Free Access
Fig. A.1
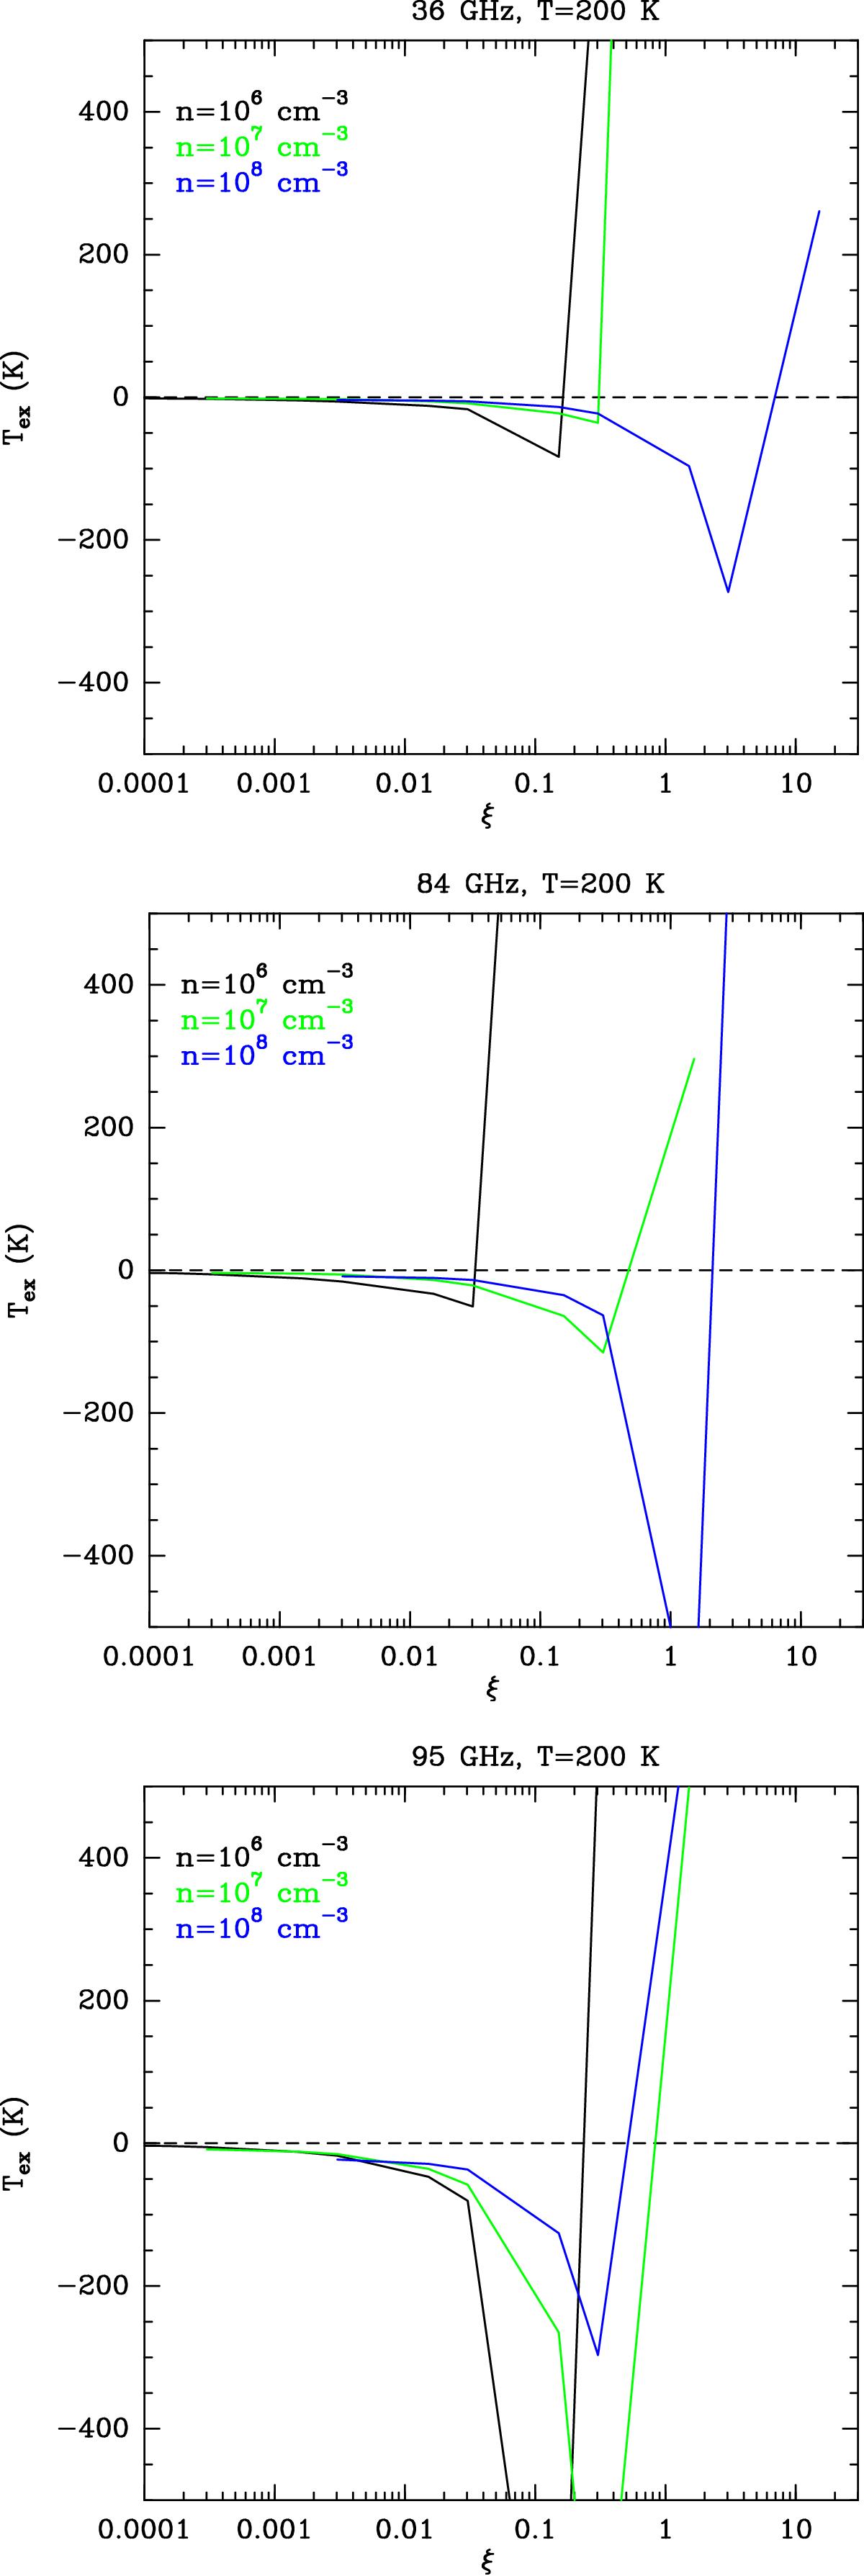
Excitation temperature of the 36 GHz (upper panel), 84 GHz (middle panel), and 95 GHz lines (lower panel) at different densities and for a temperature of 200 K. Curves are plotted until Tex becomes positive. It is possible to convert ξ to methanol abundance using Eq. (3).
This figure is made of several images, please see below:
Current usage metrics show cumulative count of Article Views (full-text article views including HTML views, PDF and ePub downloads, according to the available data) and Abstracts Views on Vision4Press platform.
Data correspond to usage on the plateform after 2015. The current usage metrics is available 48-96 hours after online publication and is updated daily on week days.
Initial download of the metrics may take a while.