Fig. 10
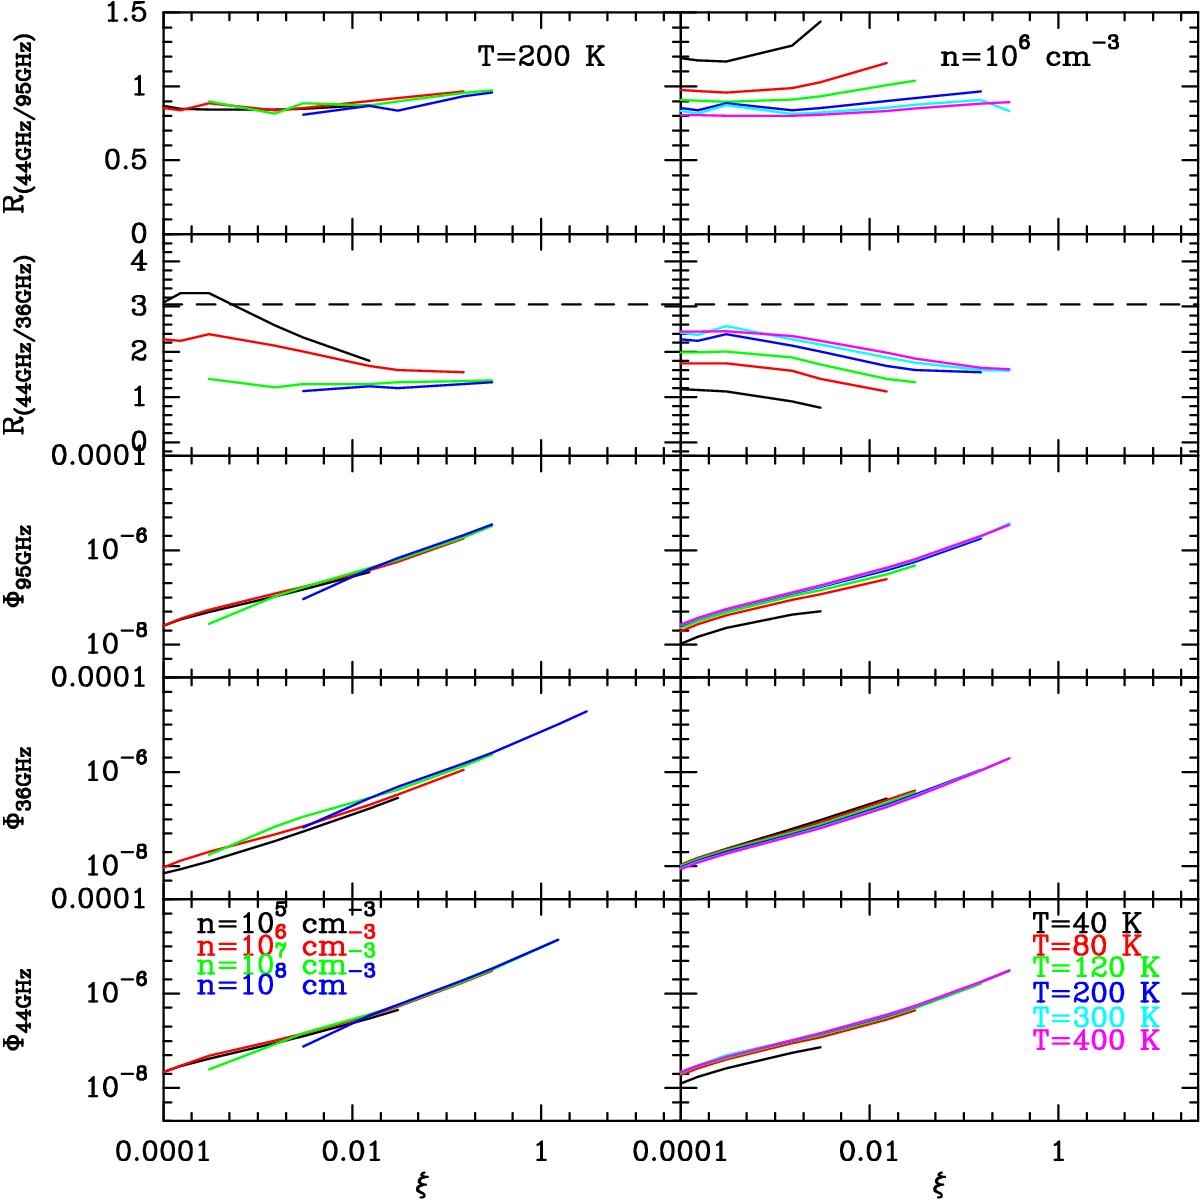
Modelling results for the 44 GHz, 36 GHz, and 95 GHz maser photon production rates, and for their ratios at 200 K for various densities (left panel) and at n = 106 cm-3 and several temperatures (right panel). The horizontal dashed line in the panels showing the 44 GHz to 36 GHz ratio marks the peak value of the flux-density ratio distribution reported by Voronkov et al. (2014). It is possible to convert ξ to methanol abundance using Eq. (3).
Current usage metrics show cumulative count of Article Views (full-text article views including HTML views, PDF and ePub downloads, according to the available data) and Abstracts Views on Vision4Press platform.
Data correspond to usage on the plateform after 2015. The current usage metrics is available 48-96 hours after online publication and is updated daily on week days.
Initial download of the metrics may take a while.