Fig. 9
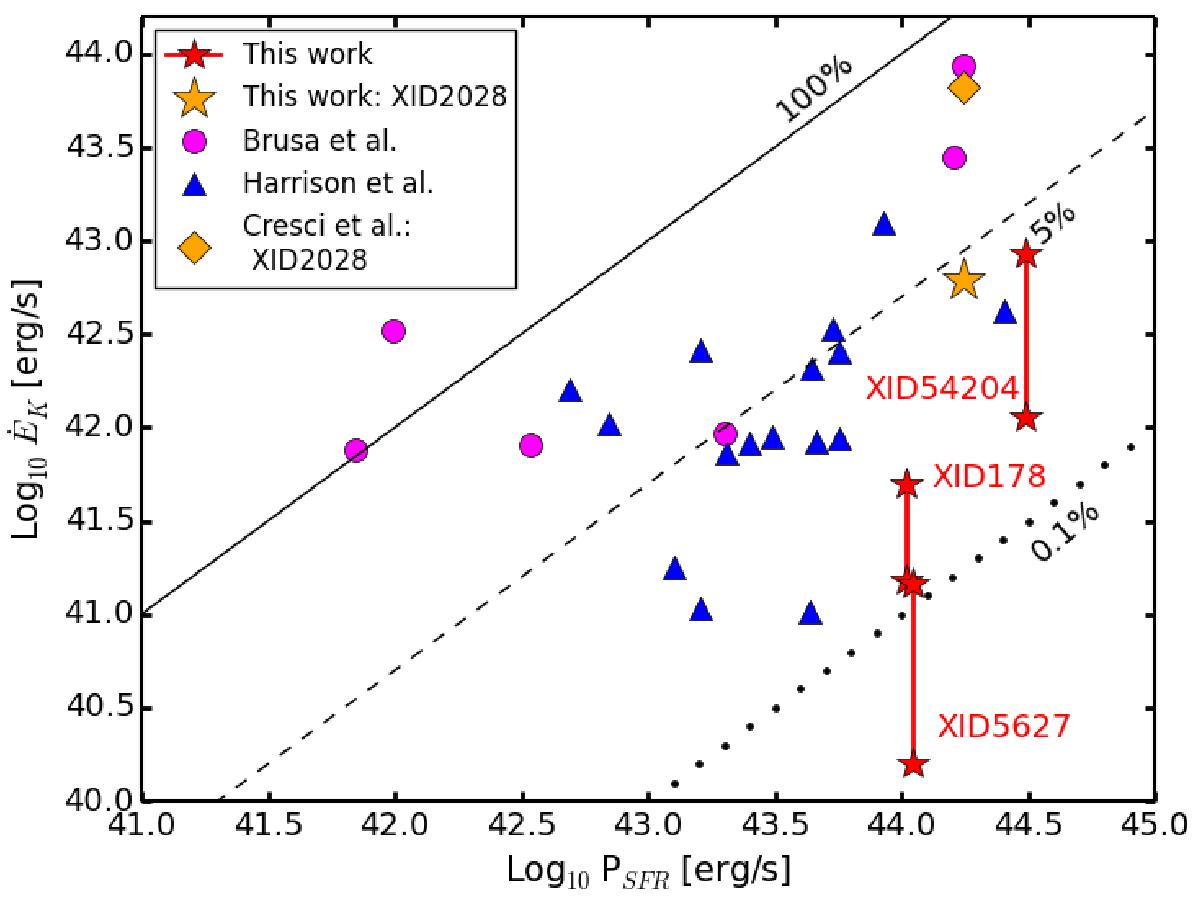
Kinetic outflow power, ĖK vs. the power driven by star formation, PSFR. The solid, dashed, and dotted lines represent 100%, 5%, and 0.1% ratios between the two powers. Our sample is represented by the star symbols, while the other data points are from Brusa et al. (2015a), Cresci et al. (2015), and Harrison et al. (2014). All data points represent outflow powers due to the ionized gas calculated from [O iii] λ5007 line, except the data point from (XID2028: Cresci et al. 2015), which represents one of the objects from our selection and whose outflow properties were reported using the Hβ line. The two points for XID2028 show the differences in power estimates from the two emission lines. The range of kinetic power from our sample is due to the different prescriptions used to derive the outflow velocity.
Current usage metrics show cumulative count of Article Views (full-text article views including HTML views, PDF and ePub downloads, according to the available data) and Abstracts Views on Vision4Press platform.
Data correspond to usage on the plateform after 2015. The current usage metrics is available 48-96 hours after online publication and is updated daily on week days.
Initial download of the metrics may take a while.