Fig. 8
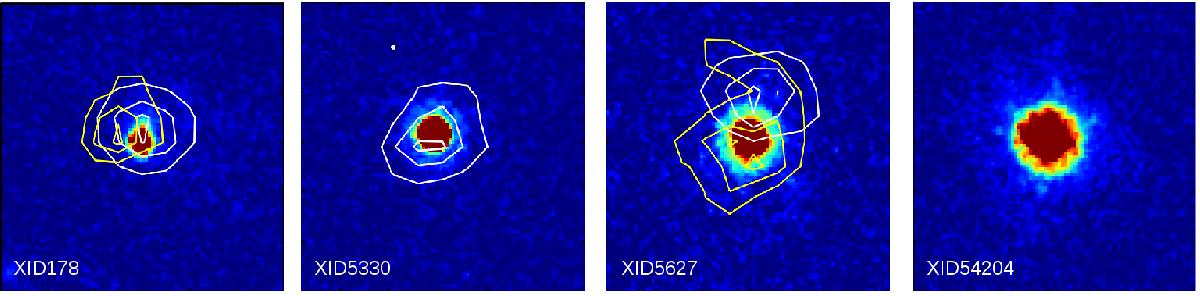
3′′× 3′′ HST-ACS images of the sample presented in this paper, with a spatial scale of 3′′× 3′′ for each object. For XID178 and XID5627, the white contours represent the narrow component of the [O iii] λ5007 emission line profile, while the yellow contours represent the broad component; for XID5330, the white contours represent the single Gaussian component of [O iii] λ5007. All contours are at 50%, 75%, and 95% levels. The SINFONI data are not corrected for astrometry.
Current usage metrics show cumulative count of Article Views (full-text article views including HTML views, PDF and ePub downloads, according to the available data) and Abstracts Views on Vision4Press platform.
Data correspond to usage on the plateform after 2015. The current usage metrics is available 48-96 hours after online publication and is updated daily on week days.
Initial download of the metrics may take a while.