Fig. 7
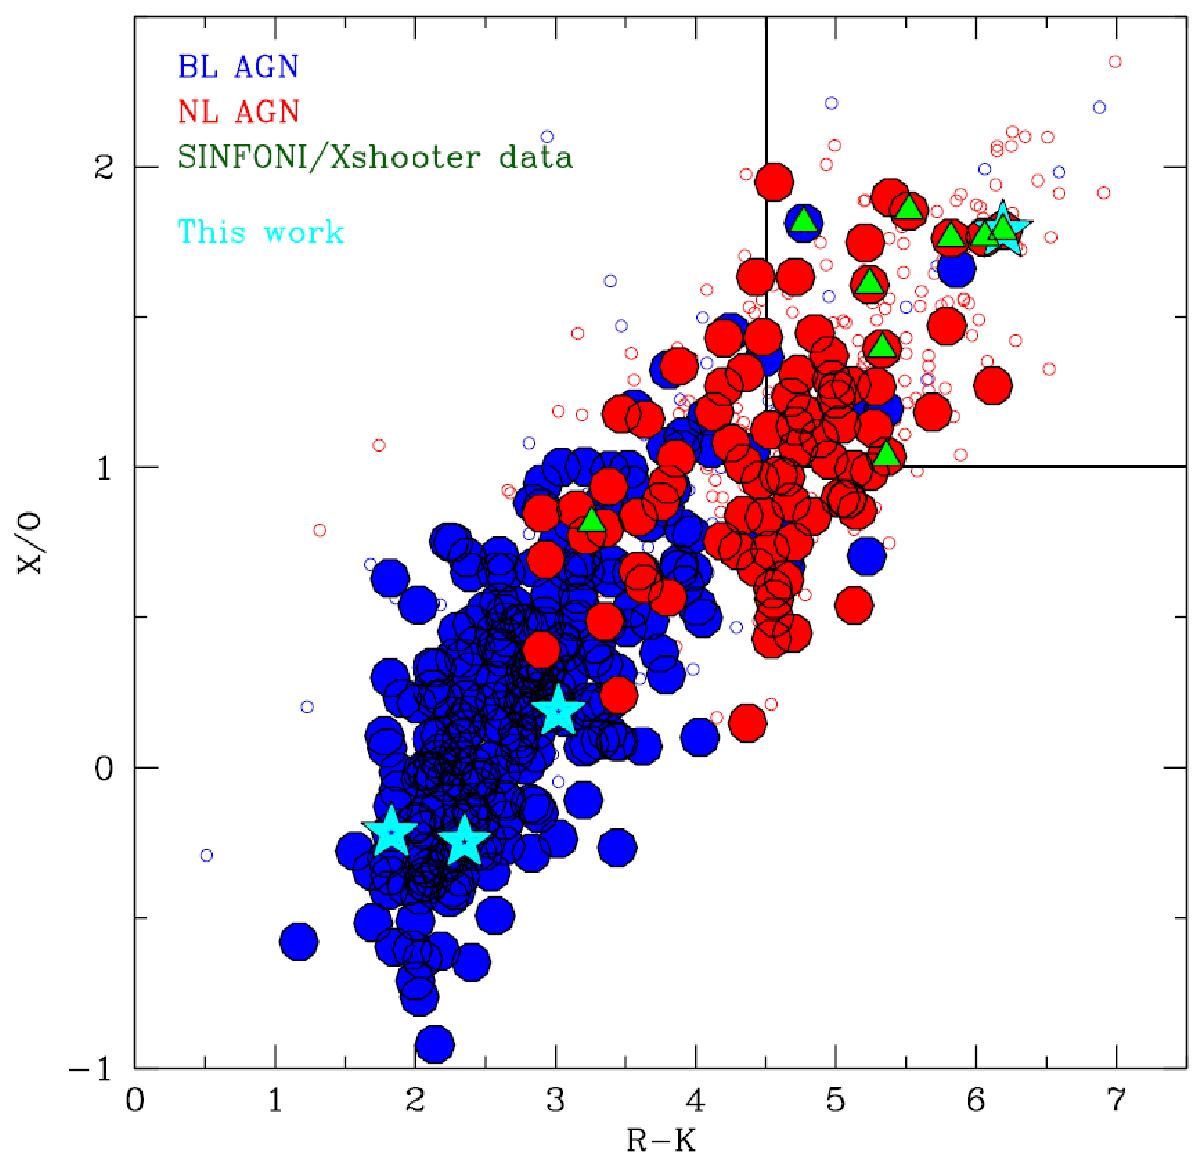
X-ray to optical flux ratio (X/O) vs. R−K (Vega) colour magnitude plot. Open circles represent all the data points from the XMM-COSMOS survey, red and blue filled circles represent the spectroscopically confirmed narrow line and broad line AGNs, respectively. In green are the AGNs with detected outflows published in Brusa et al. (2015a) and Perna et al. (2015b). Data points in starred cyan represent the objects from this paper. Clearly, we are exploring a different region of the plane with our sample.
Current usage metrics show cumulative count of Article Views (full-text article views including HTML views, PDF and ePub downloads, according to the available data) and Abstracts Views on Vision4Press platform.
Data correspond to usage on the plateform after 2015. The current usage metrics is available 48-96 hours after online publication and is updated daily on week days.
Initial download of the metrics may take a while.