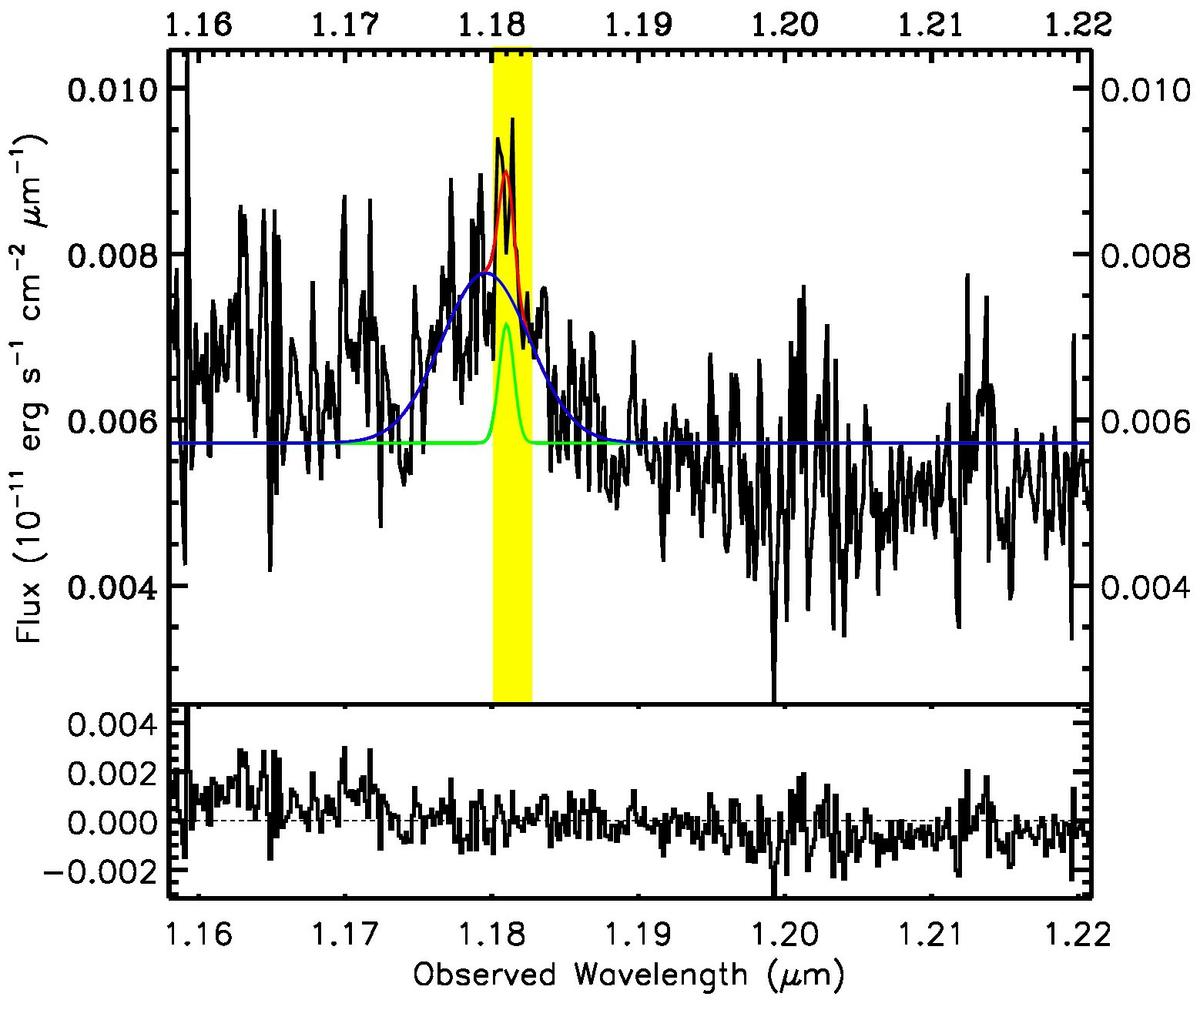
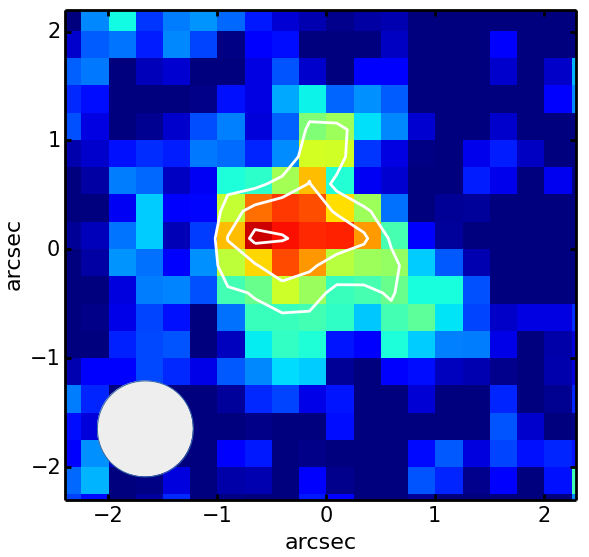
Fig. 6
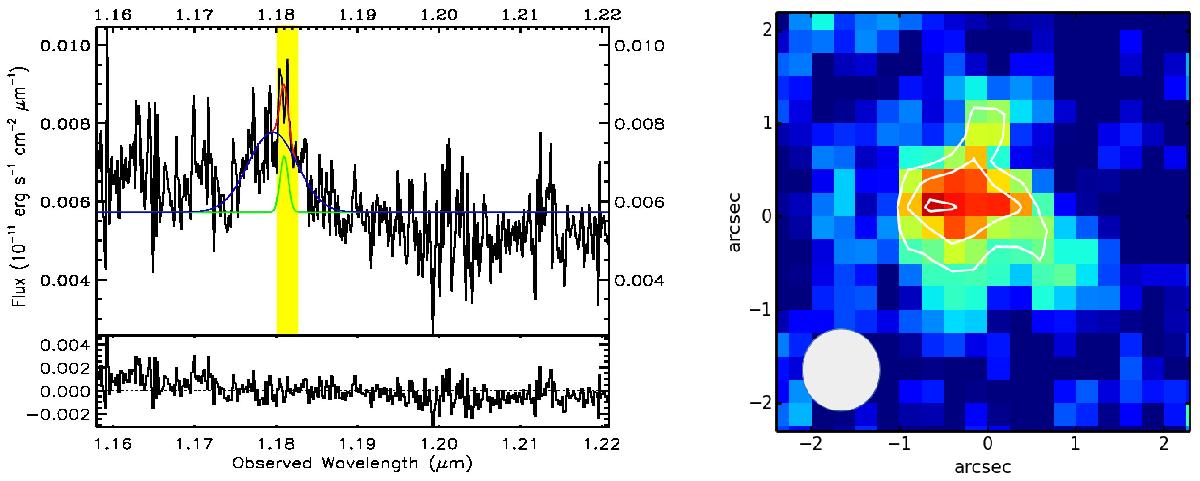
Left panel: the J-band spectrum of XID54204 around [O iii] λ5007 line extracted from a region of 1′′× 1′′ centred at the QSO position. The colour-coding for different part of the spectra are defined in the same way as Fig. 2, top panel. Right panel: continuum collapsed channel map around the narrow component of [O iii] λ5007 line (yellow region in the left panel, 1.180−1.182 μm). Each pixel corresponds to a spatial scale of 0.25′′ which at the redshift of this object is equivalent to ~2.16 kpc. The white contours indicate the peak of the [O iii] λ5007 emission at levels 50%, 75% and 95%. North is up and east is towards left. The grey circle on the lower left shows the size of PSF.
Current usage metrics show cumulative count of Article Views (full-text article views including HTML views, PDF and ePub downloads, according to the available data) and Abstracts Views on Vision4Press platform.
Data correspond to usage on the plateform after 2015. The current usage metrics is available 48-96 hours after online publication and is updated daily on week days.
Initial download of the metrics may take a while.