Fig. 4
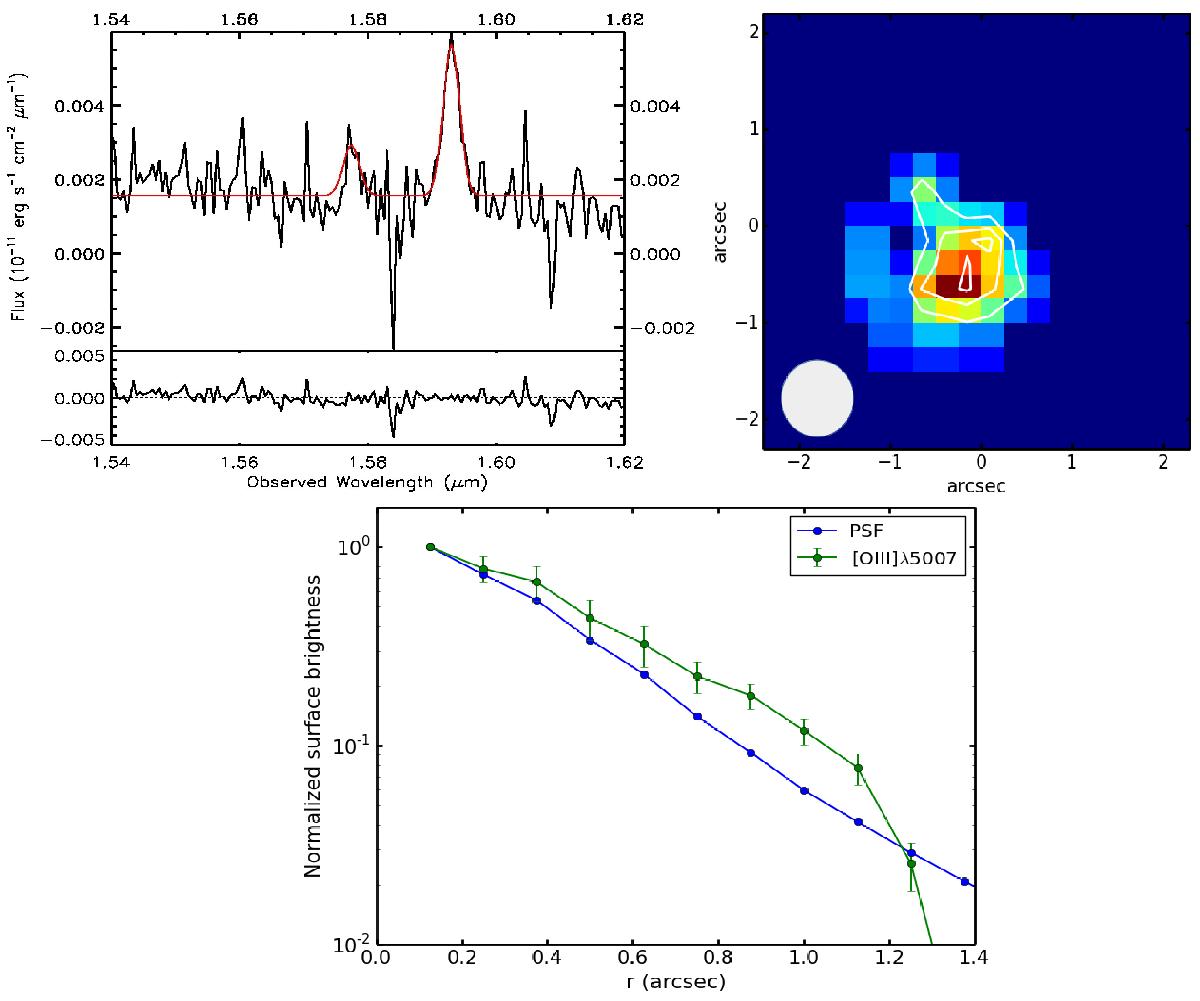
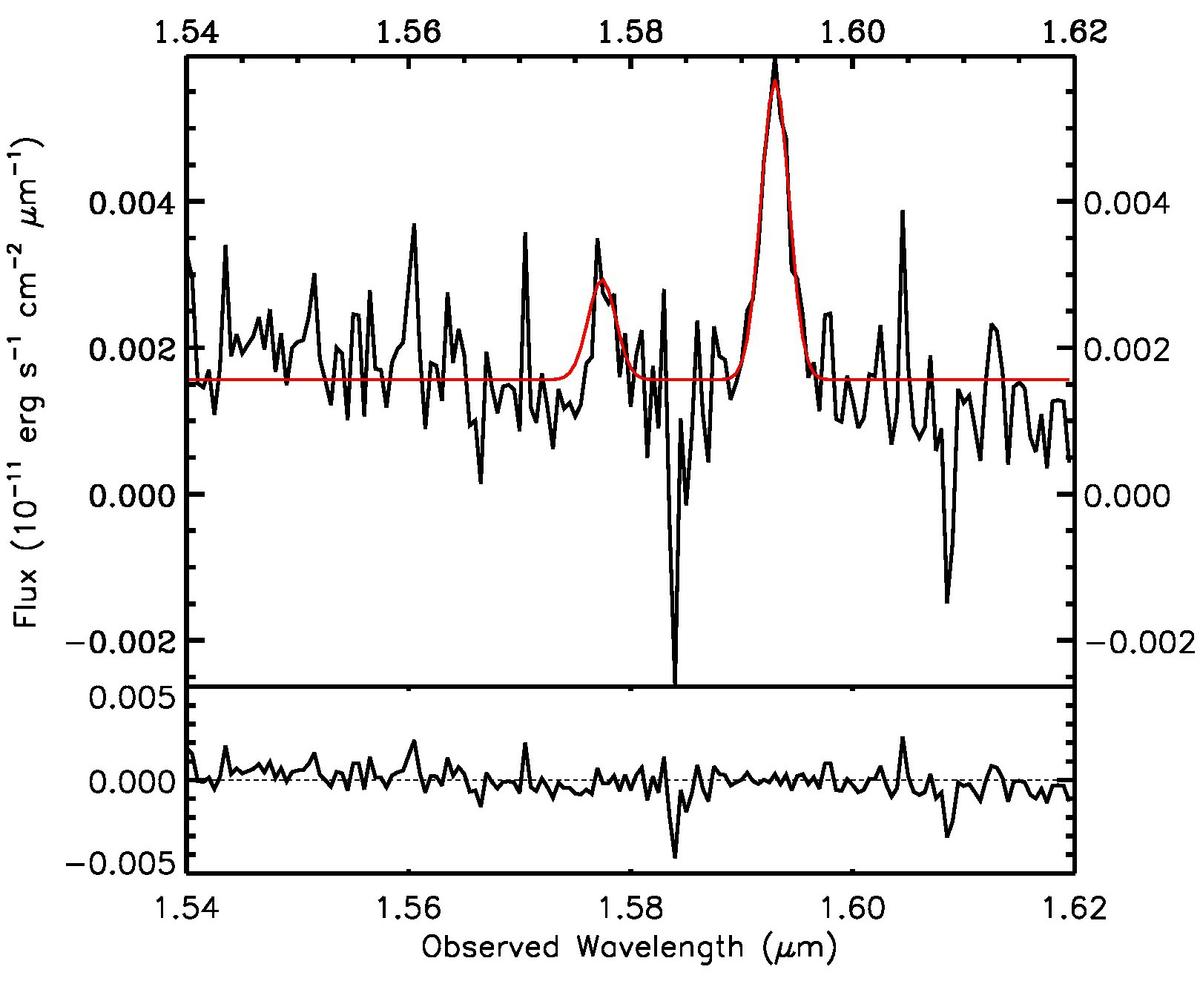
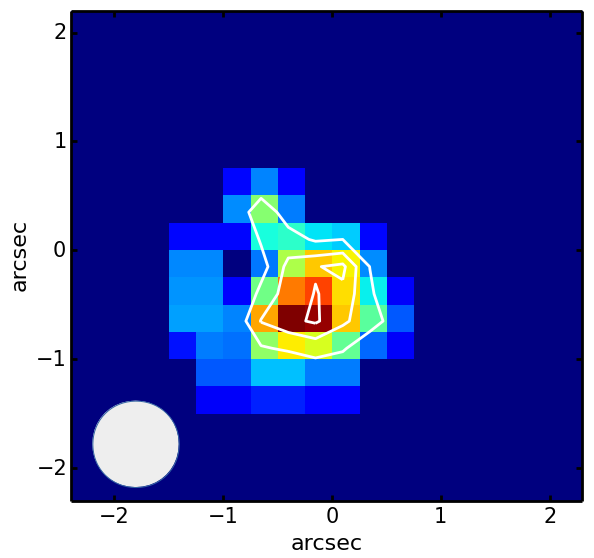
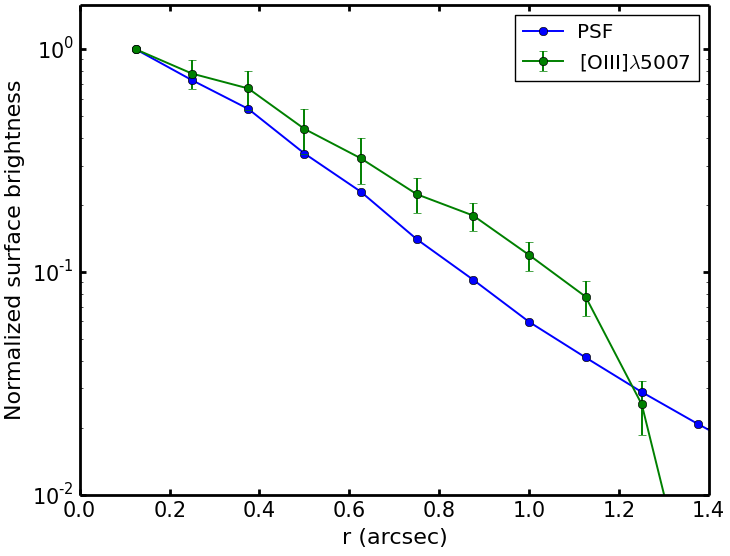
Top left: H-band spectra of XID5330 around the [O iii] λ4959, 5007 lines extracted from a region of 1′′× 1′′ centred at the QSO position. The observed spectrum in shown in black and the full fit model is shown in red. Owing to low S/N on the spectra, only a single Gaussian component was used for line fitting. The lower panel shows the residuals of the line fit. Top right: map tracing the Gaussian component in the [O iii] λ5007 profile of XID5330. The white contours show the continuum levels at 50%, 75%, and 95%. Each pixel corresponds to a spatial scale of 0.25′′ (~2.12 kpc). North is up and east is left. The grey circle on the lower left shows the size of PSF. Bottom panel: surface brightness profile of the narrow component of the map in the top right panel compared to the PSF profile. The [O iii] λ5007 emission is extended up to 1.1′′ (~9.5 kpc).
Current usage metrics show cumulative count of Article Views (full-text article views including HTML views, PDF and ePub downloads, according to the available data) and Abstracts Views on Vision4Press platform.
Data correspond to usage on the plateform after 2015. The current usage metrics is available 48-96 hours after online publication and is updated daily on week days.
Initial download of the metrics may take a while.