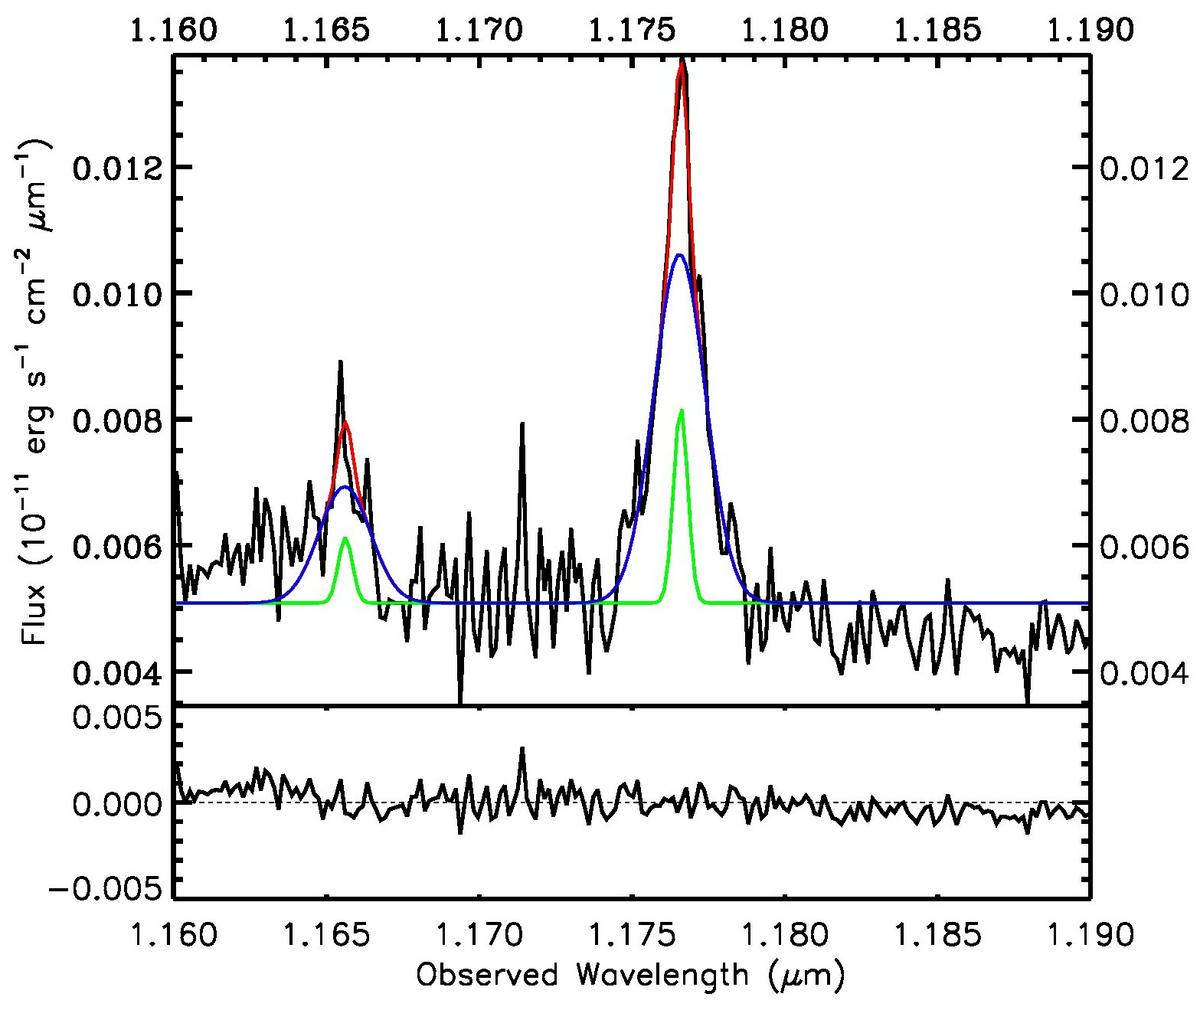
Fig. 3
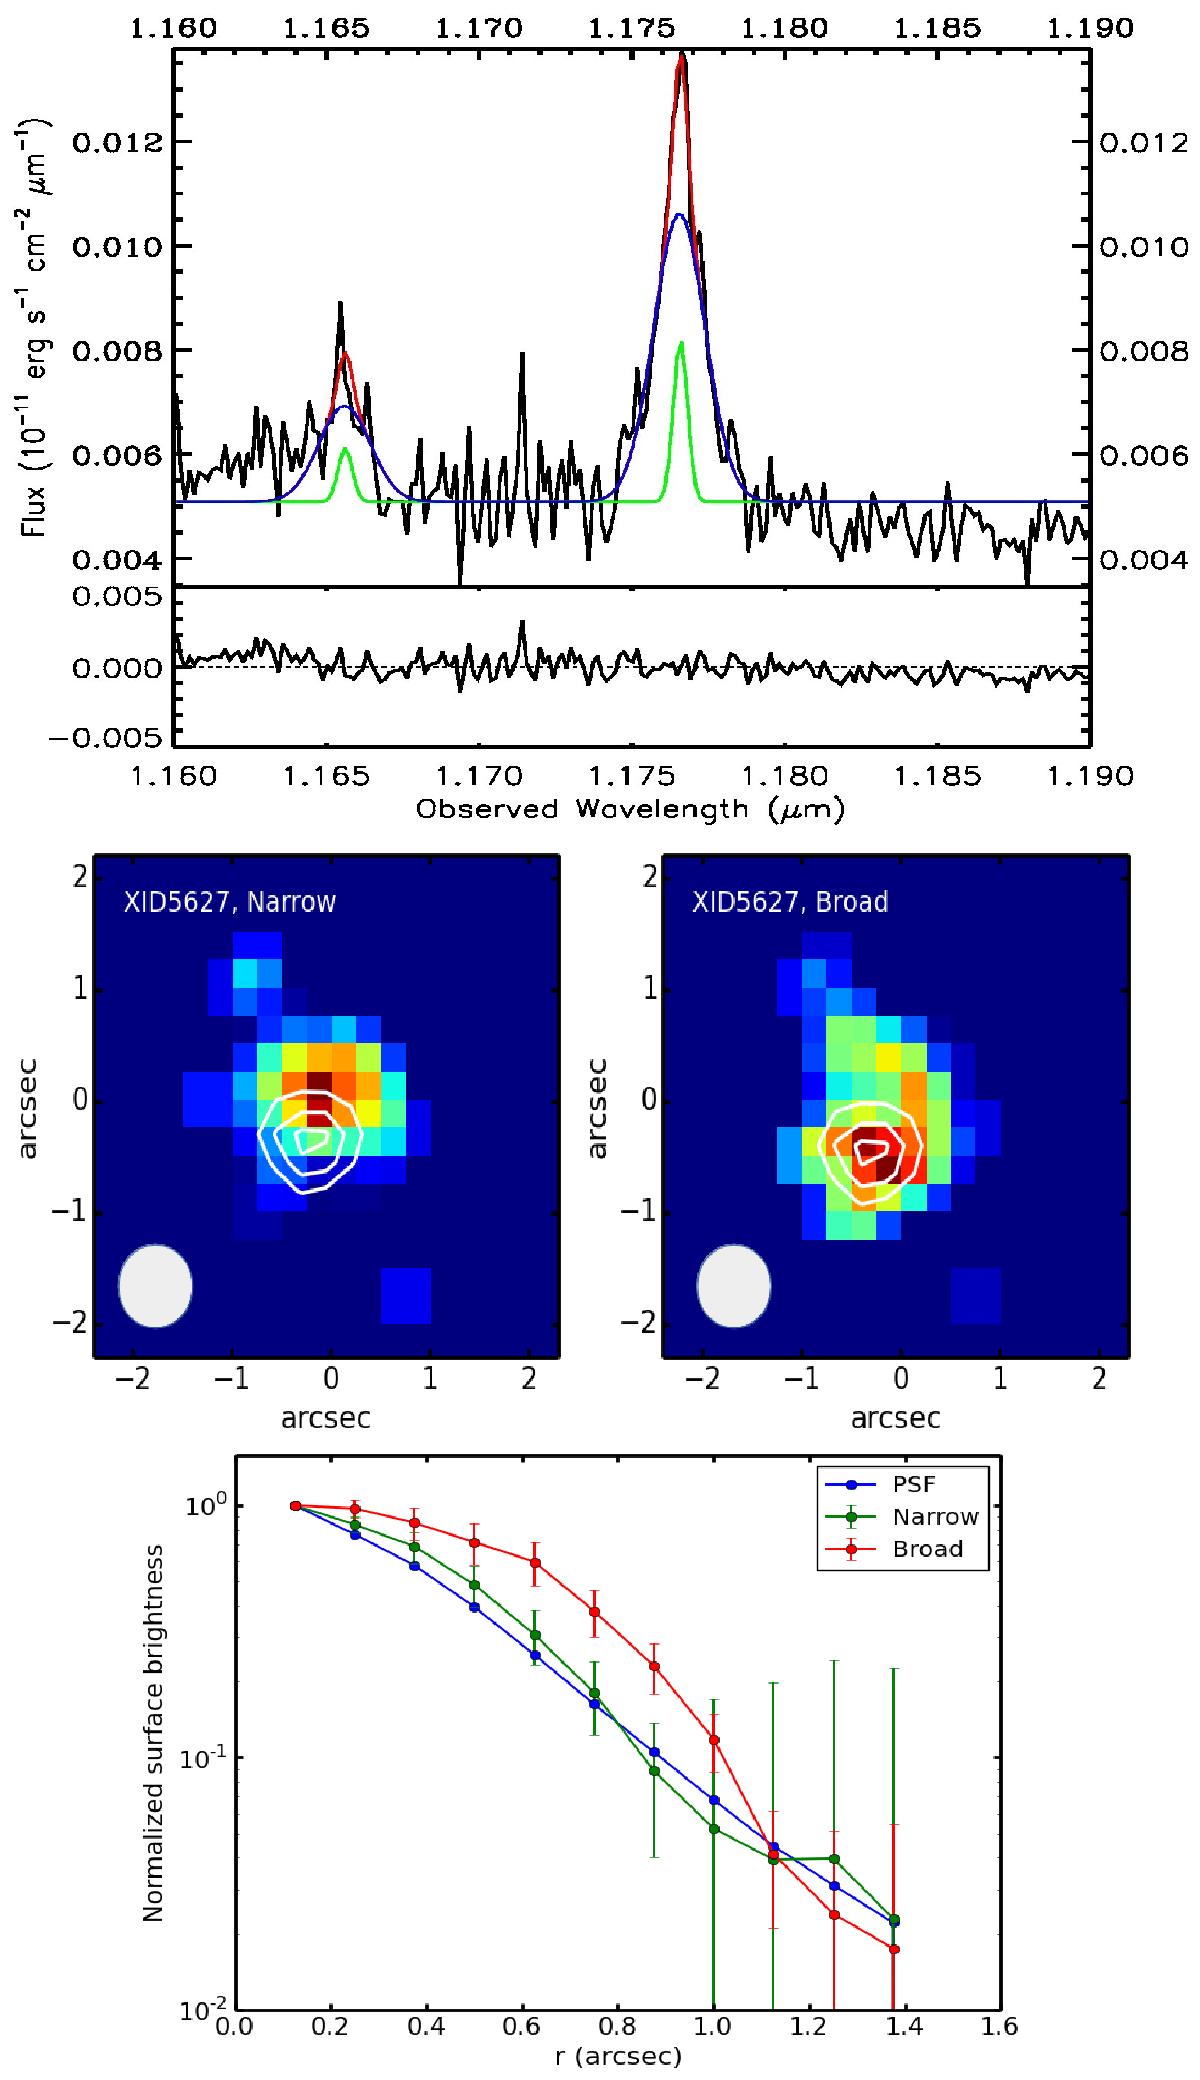
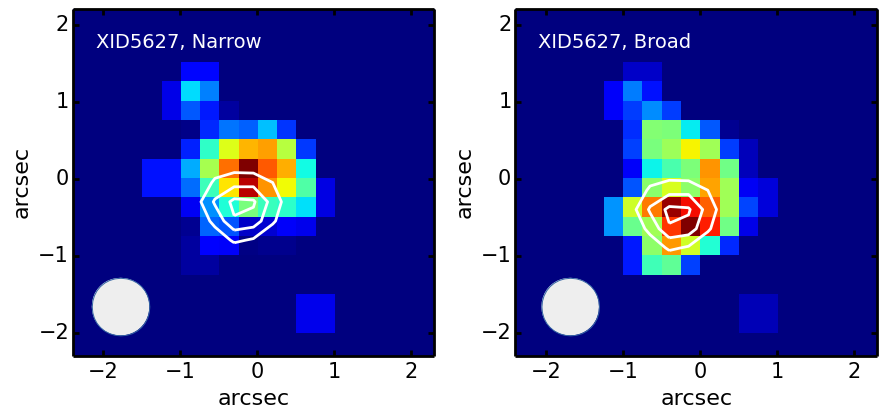
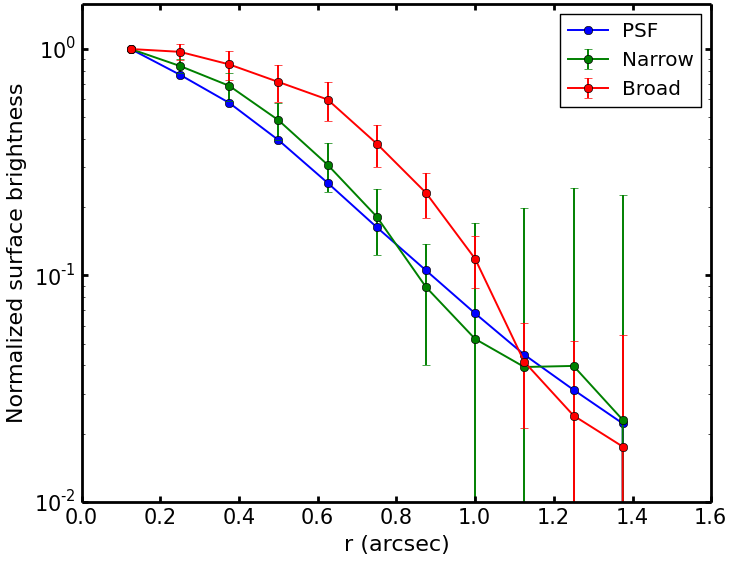
Upper panel: J-band spectrum of XID5627 around the [O iii] λ4959, 5007 lines extracted from a region of 1′′× 1′′ centred at the QSO position. The colour-coding for the plot is the same as for XID178 in Fig. 2. The residuals of the fit are shown in the smaller panel below the integrated spectrum. Middle panel: maps of the narrow (left) and broad (right) component in the [O iii] λ5007 profile for XID5627. Each pixel corresponds to a spatial scale of 0.25′′, which at the redshift of this object is equivalent to 2.16 kpc. The white contours in these maps represent the respective continuum emission of the object at levels 50%, 75%, and 95%. North is up and east is left. The maps show a significant offset between the spatial locations of narrow and broad emission. The grey circle on the lower left shows the size of PSF. Lower panel: surface brightness profiles of the individual Gaussian components in XID5627 derived from the flux maps in the middle panel. The green curve denotes the narrow component, the red curve the broad component and the blue curve the PSF of the observations. Only the broad component shows an extension. The narrow component is point-like since it is consistent with the profile of the PSF star.
Current usage metrics show cumulative count of Article Views (full-text article views including HTML views, PDF and ePub downloads, according to the available data) and Abstracts Views on Vision4Press platform.
Data correspond to usage on the plateform after 2015. The current usage metrics is available 48-96 hours after online publication and is updated daily on week days.
Initial download of the metrics may take a while.