Fig. 10
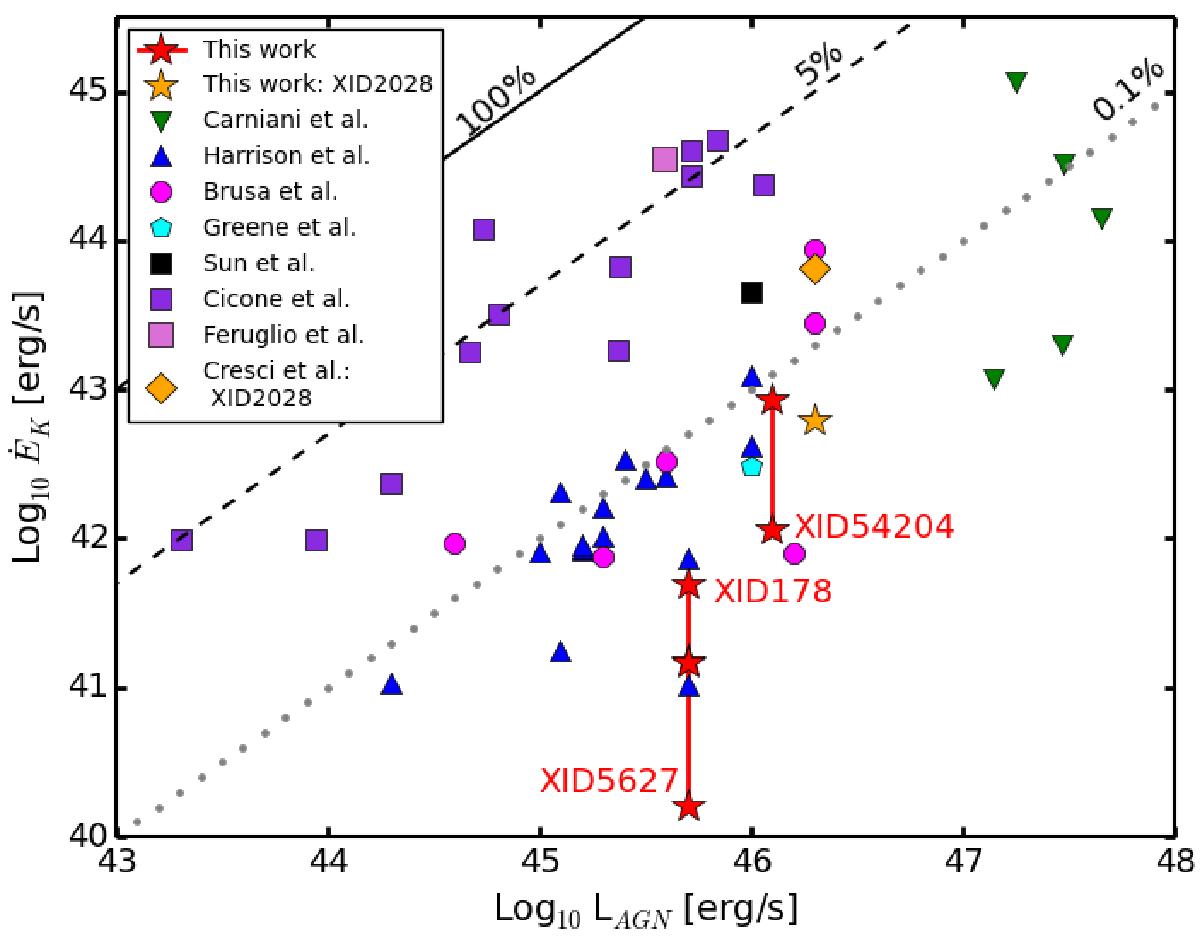
Kinetic outflow power, ĖK (ionized and molecular) vs. bolometric luminosity of the AGNs, LAGN. The solid, dashed, and dotted lines represent 100%, 5%, and 0.1% of the total bolometric luminosity of the AGNs in the form of the outflow power. The data points from this work are shown as red stars (XID178, XID5627). The molecular outflows are represented by squares (Cicone et al. 2014; Feruglio et al. 2015; Sun et al. 2014), while the rest of the data points represent ionized outflows (Carniani et al. 2015; Harrison et al. 2014; Cresci et al. 2015; Brusa et al. 2015a; Greene et al. 2012). The outflow properties for all the ionized outflows were obtained using the [O iii] λ5007 line except for Cresci et al. (2015) whose analysis from Hβ is shown in this plot to represent the differences in analysis between the two lines for the same data.
Current usage metrics show cumulative count of Article Views (full-text article views including HTML views, PDF and ePub downloads, according to the available data) and Abstracts Views on Vision4Press platform.
Data correspond to usage on the plateform after 2015. The current usage metrics is available 48-96 hours after online publication and is updated daily on week days.
Initial download of the metrics may take a while.