Fig. 1
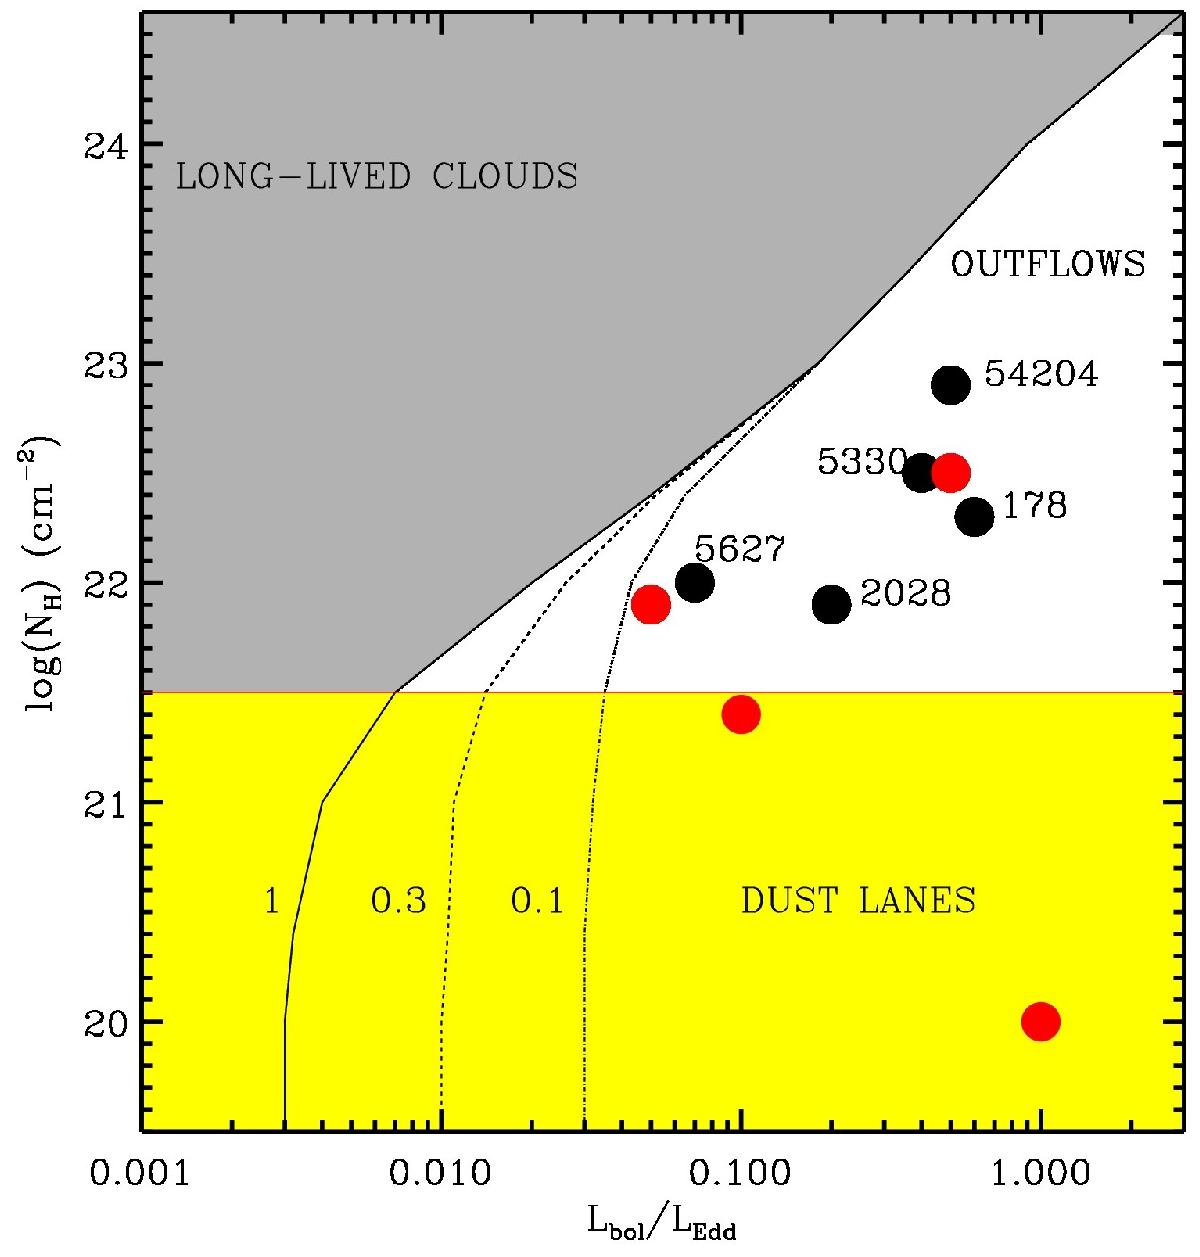
Our sample from the COSMOS field in the hydrogen column density, NH vs. Eddington ratio, λ = Lbol/LEdd plot, adapted from Fabian et al. (2008). The data points from this work are indicated by black circles, while the red circles are from Brusa et al. (2015a) for the objects where the presence of outflows has been verified (see Sect. 7). Various regions of the plot are divided by the expected Eddington limit curves shown in solid, dashed, and dotted lines representing Galactic dust abundance, 0.3, and 0.1 of the Galactic dust abundance, respectively. The objects in grey regions are expected to have long-lived clouds, while those in the unshaded region are expected to be in a “blow-out” or an outflowing phase.
Current usage metrics show cumulative count of Article Views (full-text article views including HTML views, PDF and ePub downloads, according to the available data) and Abstracts Views on Vision4Press platform.
Data correspond to usage on the plateform after 2015. The current usage metrics is available 48-96 hours after online publication and is updated daily on week days.
Initial download of the metrics may take a while.