| Issue |
A&A
Volume 592, August 2016
|
|
|---|---|---|
| Article Number | C1 | |
| Number of page(s) | 2 | |
| Section | Extragalactic astronomy | |
| DOI | https://doi.org/10.1051/0004-6361/201527725e | |
| Published online | 28 July 2016 | |
Polarization angle swings in blazars: The case of 3C 279 (Corrigendum)
1 Aalto University Metsähovi Radio
Observatory, Metsähovintie
114, 02540
Kylmälä,
Finland
e-mail: This email address is being protected from spambots. You need JavaScript enabled to view it.
2 Aalto University Department of Radio
Science and Engineering, PL
13000, 00076
Aalto,
Finland
3 Max-Planck-Institut für
Radioastronomie, Auf dem Hügel
69, 53121
Bonn,
Germany
4 Institute for Astrophysical Research,
Boston University, 725 Commonwealth
Avenue, Boston,
MA
02215,
USA
5 Astronomical Institute, St.
Petersburg State University, Universitetskij Pr. 28, Petrodvorets, 198504
St. Petersburg,
Russia
6 Astro Space Center of Lebedev
Physical Institute, Profsoyuznaya
84/32, 117997
Moscow,
Russia
7 Sternberg Astronomical Institute,
M.V. Lomonosov Moscow State University, Universiteskij prosp. 13,
Moscow
119991,
Russia
8 Institute of Astronomy, Astrophysics,
Space Applications and Remote Sensing, National Observatory of Athens,
Vas. Pavlou & I.
Metaxa, 15 236
Penteli,
Greece
9 Department of Physics and Astronomy,
University of New Mexico, Albuquerque
NM, 87131,
USA
10 Main (Pulkovo) Astronomical
Observatory of RAS, Pulkovskoye
shosse, 60, 196140
St. Petersburg,
Russia
11 Instituto de Astrofísica de
Andalucía, CSIC, Apartado
3004, 18080
Granada,
Spain
12 Hiroshima Astrophysical Science
Center, Hiroshima University, Higashi-Hiroshima, 739-8526
Hiroshima,
Japan
13 Instituto de Astronomía,
Universidad Nacional Autónoma de México, 04510
México DF,
Mexico
14 Tuorla Observatory, Department of
Physics and Astronomy, University of Turku, Väisäläntie 20, 21500
Piikkiö,
Finland
15 Foundation for Research and
Technology – Hellas, IESL, Voutes, 71110 Heraklion,
Greece
16 Department of Physics and Institute
for Plasma Physics, University of Crete, 71003
Heraklion,
Greece
17 Crimean Astrophysical Observatory, 98409 P/O Nauchny,
Crimea
18 Special Astrophysical Observatory
of the Russian AS, Nizhnij
Arkhyz, 369167
Karachaevo-Cherkesia,
Russia
19 Southern Station of the Sternberg Astronomical Institute,
Moscow M.V. Lomonosov State University, P/O Nauchny 298409, Crimea
20 Department of Physical Sciences,
Hiroshima University, Higashi-Hiroshima, Hiroshima
739-8526,
Japan
21 ZAH, Landessternwarte Heidelberg,
Königstuhl 12, 69117
Heidelberg,
Germany
22 Instituto de Astronomía,
Universidad Nacional Autónoma de México, 22860
Ensenada BC,
Mexico
23 Abastumani Observatory,
Mt. Kanobili,
0301
Abastumani,
Georgia
24 Inst. of Solar-Terrestrial Physics,
Lermontov st. 126a, p/o box 291, 664033
Irkutsk,
Russia
25 Center for Backyard Astrophysics –
New Mexico, PO Box 1351, Cloudcroft, NM
88317,
USA
26 Engelhardt Astronomical
Observatory, Kazan Federal University, Tatarstan,
Russia
27 Department of Physics and
Astronomy, University of Southampton, Southampton, SO17
1BJ, UK
28 Kavli Institute for the Physics and
Mathematics of the Universe (Kavli IPMU), The University of Tokyo,
5-1-5 Kashiwa-no-Ha,
277-8583
Kashiwa City Chiba,
Japan
29 Finnish Centre for Astronomy with
ESO (FINCA), University of Turku, Väisäläntie 20, 21500
Piikkiö,
Finland
30 Department of Physics, University of Colorado Denver, CO,
USA
31 Steward Observatory, University of
Arizona, Tucson,
AZ
85721,
USA
32 Lowell Observatory,
Flagstaff,
AZ
86001,
USA
Key words: polarization / galaxies: active / galaxies: jets / quasars: individual: 3C 279 / errata, addenda
We mistakenly used a preliminary version of Fig. 8, based on just 20 000 simulations instead of 1 000 000 simulations as intended and stated in the manuscript. Here, we show the correct figure based on 1 000 000 simulations. Accordingly, the number of simulations, which fulfil the conditions on the mean and standard deviation of the polarization fraction, N, which is given in the legend of the figure for each model, is approximately 50 times higher than shown in the wrong figure. In comparison with Fig. 10, these numbers indicate that it is more likely that the three tested random walk processes produce the mean and standard deviation of the polarization fraction as observed during period IIa than observed during period IIIc. None of the results and conclusions presented in the original manuscript were affected by the inclusion of the wrong figure.
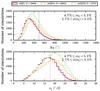 |
Fig. 8 Distribution of the EVPA rotation amplitude (upper panel) and distribution of the EVPA variation estimator (lower panel) for all simulations with a mean polarization fraction consistent with the observed value during period IIa. The number of selected simulations is indicated in the legend. The corresponding observed values are indicated by black dotted lines. |
© ESO, 2016
All Figures
|
Fig. 8 Distribution of the EVPA rotation amplitude (upper panel) and distribution of the EVPA variation estimator (lower panel) for all simulations with a mean polarization fraction consistent with the observed value during period IIa. The number of selected simulations is indicated in the legend. The corresponding observed values are indicated by black dotted lines. |
| In the text | |
Current usage metrics show cumulative count of Article Views (full-text article views including HTML views, PDF and ePub downloads, according to the available data) and Abstracts Views on Vision4Press platform.
Data correspond to usage on the plateform after 2015. The current usage metrics is available 48-96 hours after online publication and is updated daily on week days.
Initial download of the metrics may take a while.