Fig. 8
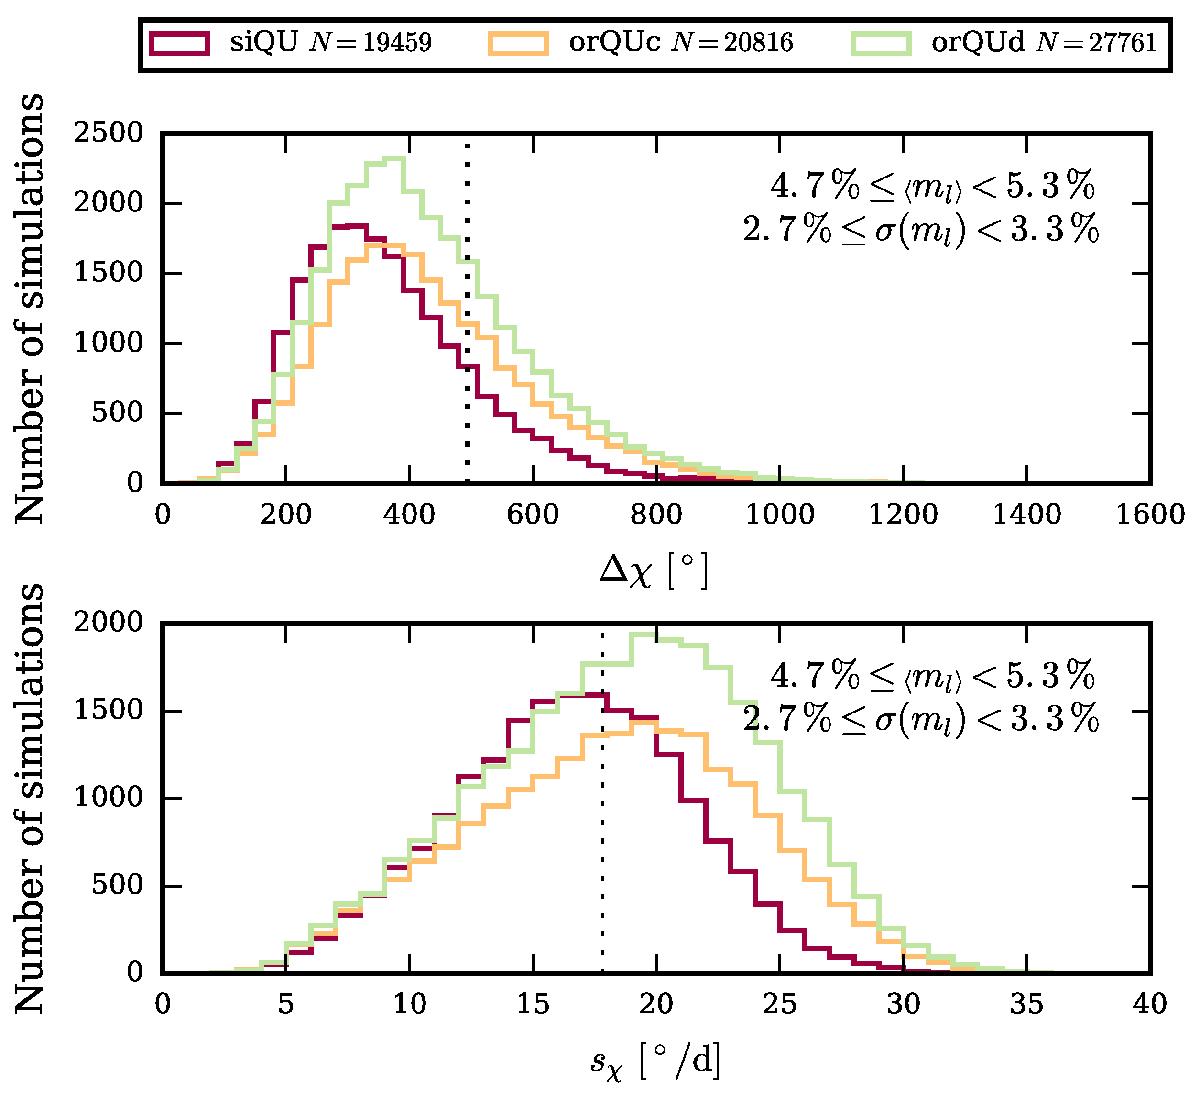
Distribution of the EVPA rotation amplitude (upper panel) and distribution of the EVPA variation estimator (lower panel) for all simulations with a mean polarization fraction consistent with the observed value during period IIa. The number of selected simulations is indicated in the legend. The corresponding observed values are indicated by black dotted lines.
Current usage metrics show cumulative count of Article Views (full-text article views including HTML views, PDF and ePub downloads, according to the available data) and Abstracts Views on Vision4Press platform.
Data correspond to usage on the plateform after 2015. The current usage metrics is available 48-96 hours after online publication and is updated daily on week days.
Initial download of the metrics may take a while.