Fig. 9
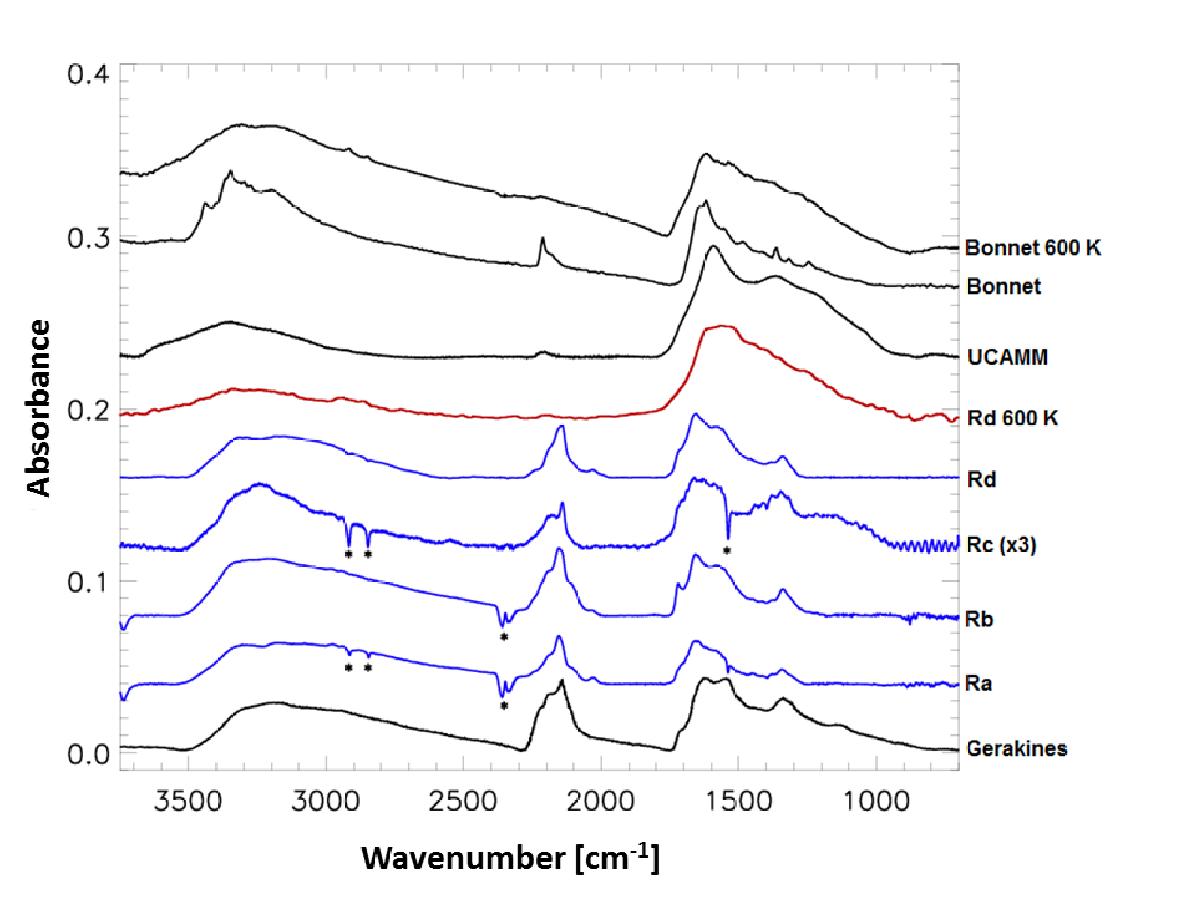
Superposition of FTIR spectra of different residues compared to the spectrum of an UCAMM. From top to bottom: poly-HCN before and after annealing to 600 K (Bonnet et al. 2015); spectrum of a UCAMM (Dartois et al. 2013); spectrum of residue “d” of this work, post-annealed to 600 K (in red), spectra of residues “a” to “d” produced in this work after irradiation and annealing to 300 K (in blue); spectrum of pure HCN ice after irradiation with 0.8 MeV protons (Gerakines et al. 2004).
Current usage metrics show cumulative count of Article Views (full-text article views including HTML views, PDF and ePub downloads, according to the available data) and Abstracts Views on Vision4Press platform.
Data correspond to usage on the plateform after 2015. The current usage metrics is available 48-96 hours after online publication and is updated daily on week days.
Initial download of the metrics may take a while.