Fig. 6
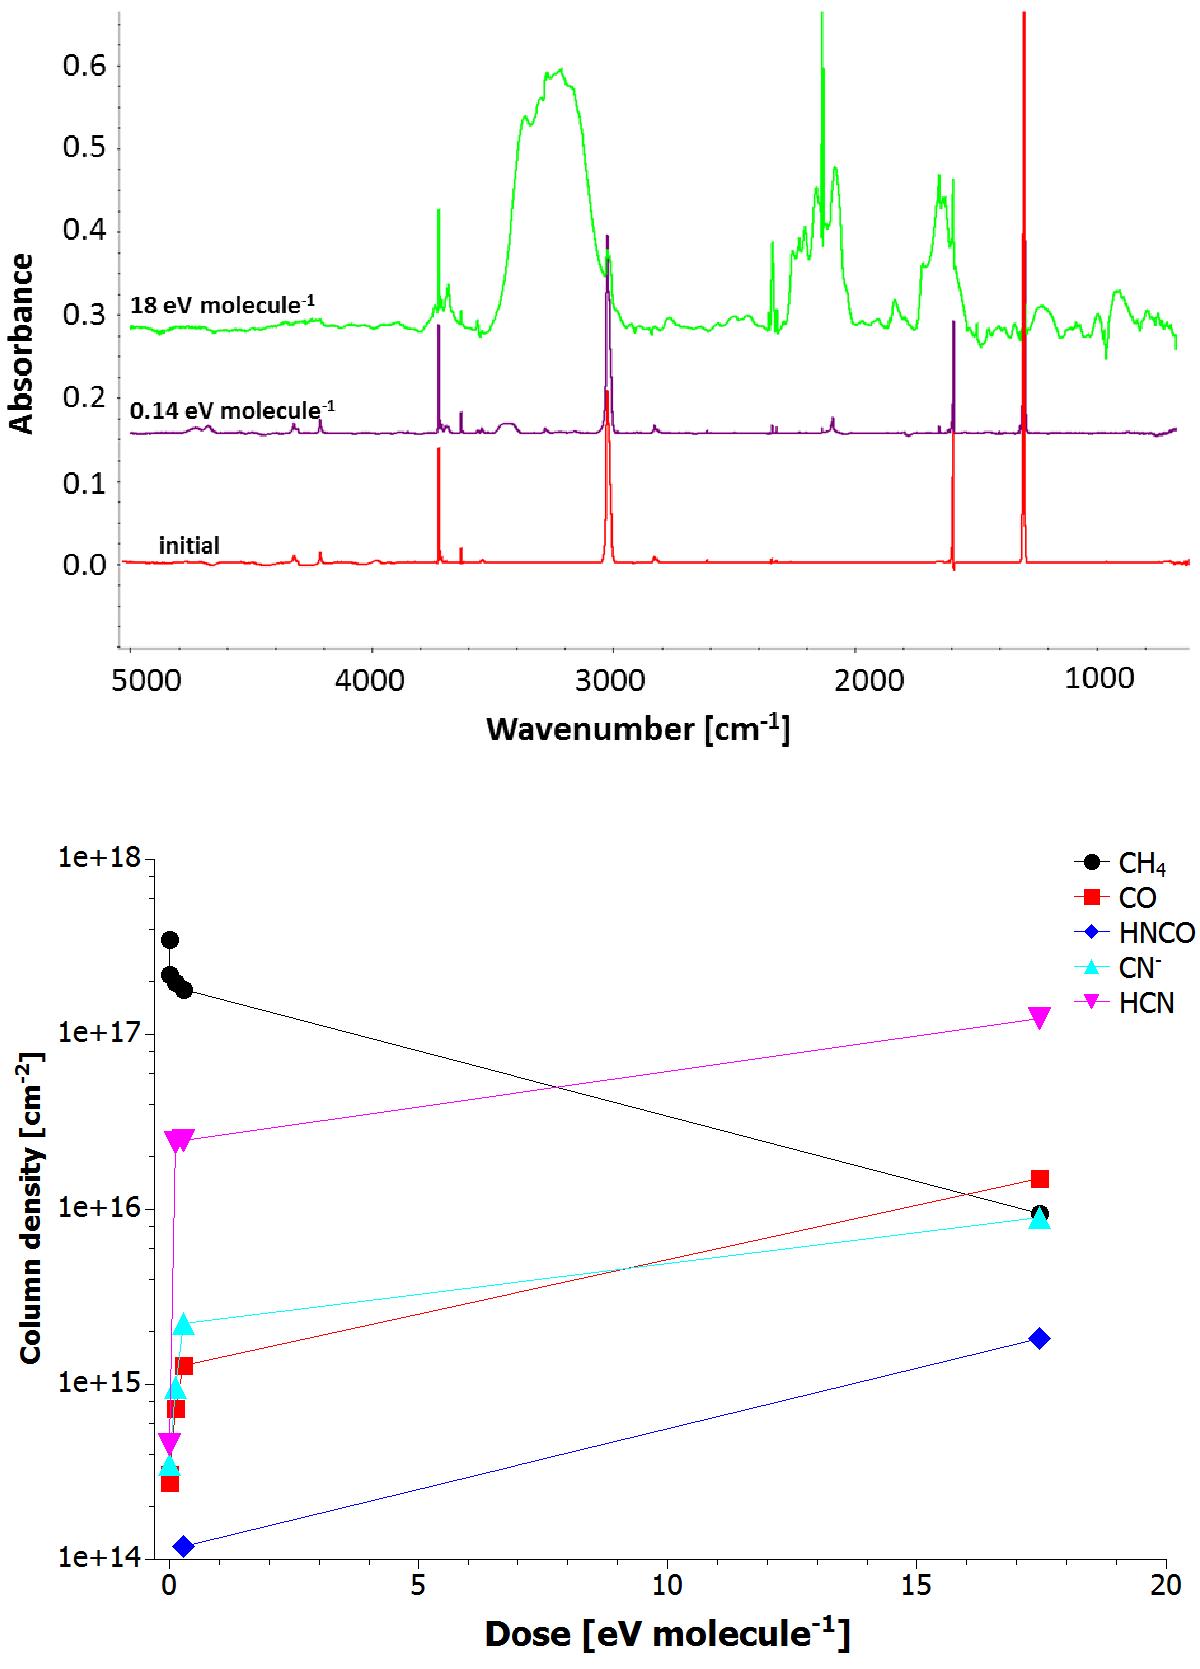
Sample d: IR spectrum from 5000 to 600 cm-1 of N2:CH4; 23μm thickness (top). From bottom to top, initial deposited ice sample (red), after a fluence of 1.7 × 10¹¹ ions cm-2 (purple) and 2.2 × 10¹³ ions cm-2 (green). The final dose is 18 eV molecule-1. The final spectra indicates the presence of solid water. Spectra were shifted for clarity. Evolution of the column density of selected molecules in the sample during the irradiation as a function of the deposited dose (bottom). As a result of a technical incident, there is no point between 1 and 18 eV molecule-1.
Current usage metrics show cumulative count of Article Views (full-text article views including HTML views, PDF and ePub downloads, according to the available data) and Abstracts Views on Vision4Press platform.
Data correspond to usage on the plateform after 2015. The current usage metrics is available 48-96 hours after online publication and is updated daily on week days.
Initial download of the metrics may take a while.