Fig. 3
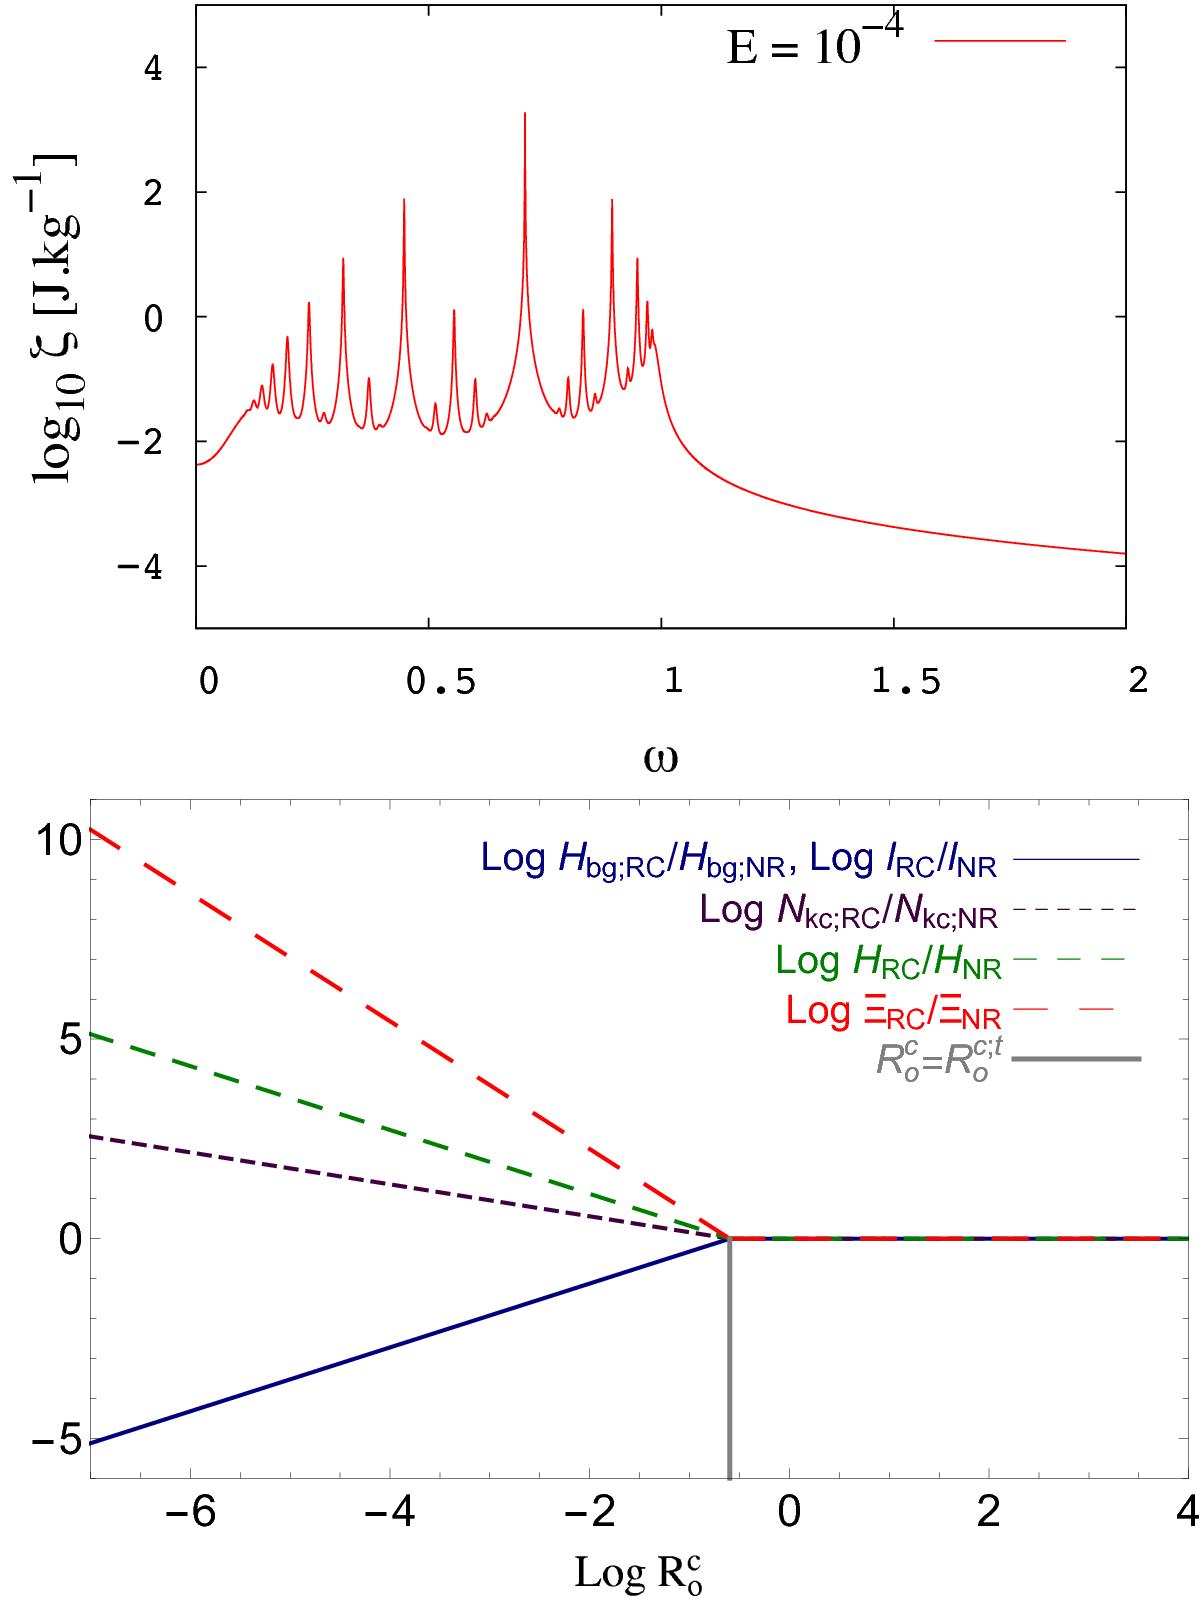
Top: tidal dissipation frequency spectrum for the academic forcing chosen here (see also Ogilvie & Lin 2004; Auclair Desrotour et al. 2015) for E = 10-4 and θ = 0 (in logarithm scale for the dissipation). Bottom: variations of the logarithm of the ratios Hbg;RC/Hbg;NR, lRC/lNR (solid blue line), Nkc;RC/Nkc;NR (dashed purple line), HRC/HNR (dashed green line) and ΞRC/ ΞNR (long-dashed red line) as a function of ![]() when taking into account (or not) the action of rotation on turbulent friction. The vertical grey solid line corresponds to the transition Rossby number
when taking into account (or not) the action of rotation on turbulent friction. The vertical grey solid line corresponds to the transition Rossby number ![]() .
.
Current usage metrics show cumulative count of Article Views (full-text article views including HTML views, PDF and ePub downloads, according to the available data) and Abstracts Views on Vision4Press platform.
Data correspond to usage on the plateform after 2015. The current usage metrics is available 48-96 hours after online publication and is updated daily on week days.
Initial download of the metrics may take a while.