Fig. 11
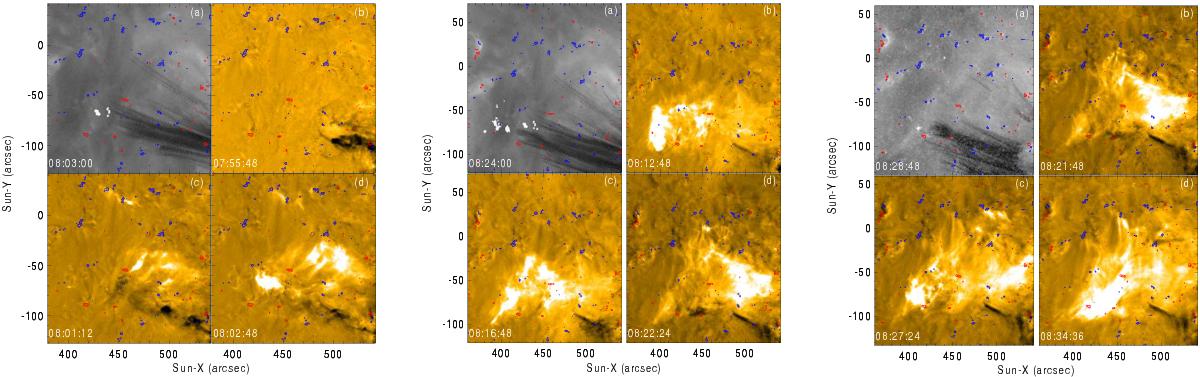
Overview of the two consecutive streams in the large impact, impact 12, as seen in UV (1600 Å) and EUV (171 Å) channels. Each panel of four shows in a) a composite of 1600 Å emission and tracks of downflows from 193 Å images and b)–d) base-difference images chosen to show the movement of the bright splash emission. The red/blue contours outline magnetic fields of +/−50 G. The base image was taken at 7:50:00 UT. The 171 Å images are scaled between ± 300 DN s-1. Left: the first EUV brightenings were from low density impacts that dissipated in the corona. Middle: a strong splash was created by the first series of chromospheric impacts. Right: the splash from the first series prevented the second series of fragments from reaching the chromosphere so there was very little 1600 Å emission. The movies show the full sequence of base-difference images at 171 and 193 Å.
Current usage metrics show cumulative count of Article Views (full-text article views including HTML views, PDF and ePub downloads, according to the available data) and Abstracts Views on Vision4Press platform.
Data correspond to usage on the plateform after 2015. The current usage metrics is available 48-96 hours after online publication and is updated daily on week days.
Initial download of the metrics may take a while.