Fig. 10
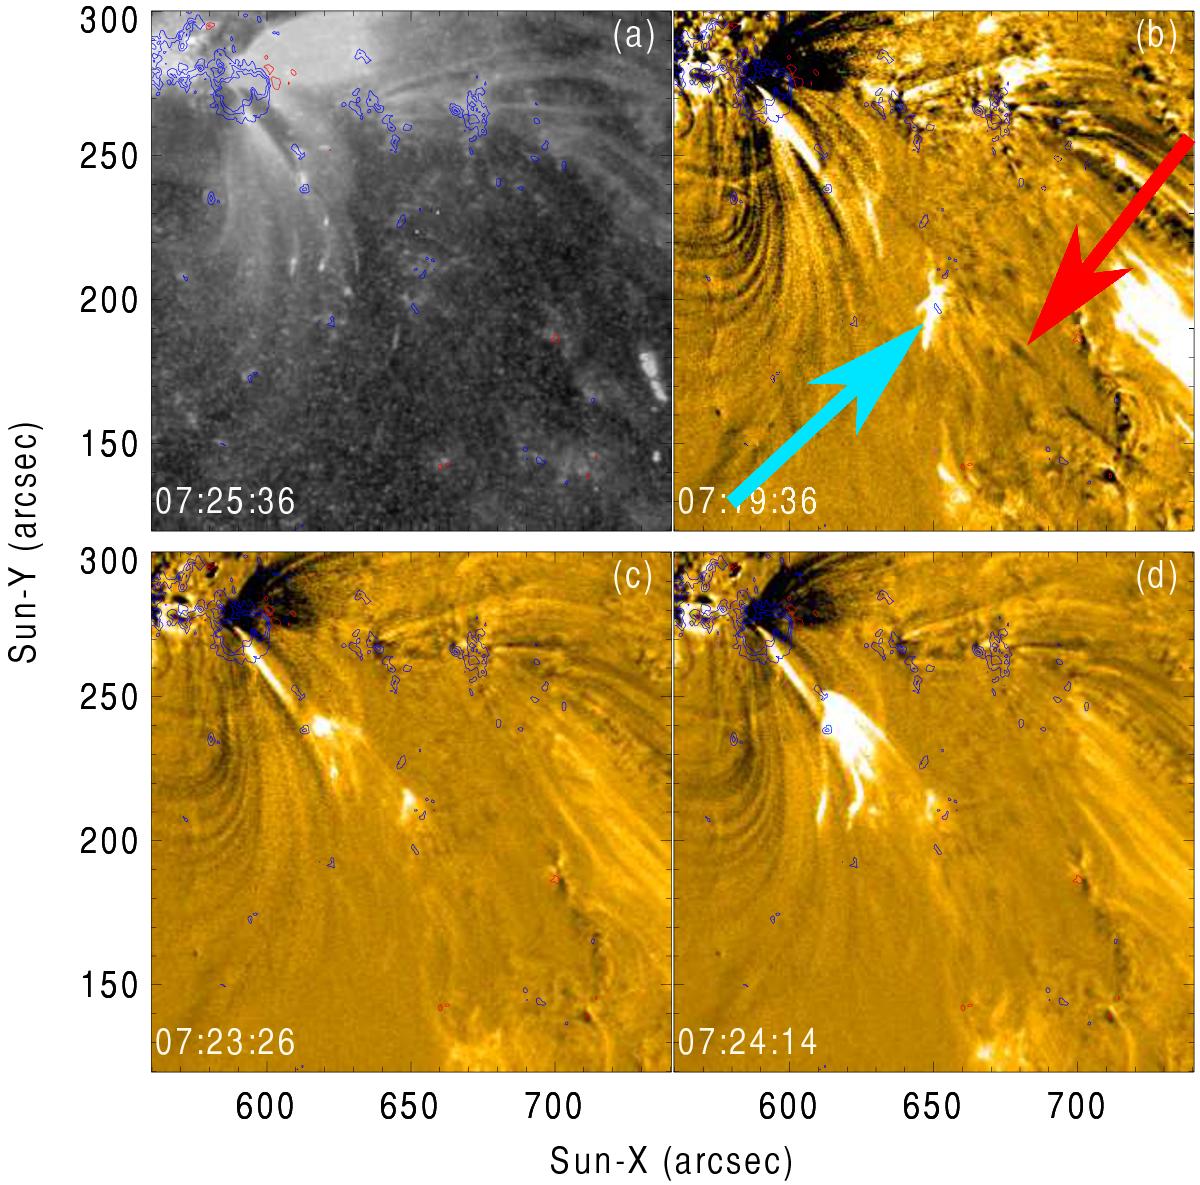
Overview of an impact, impact 9, in an active region as seen in UV (1600 Å) and EUV (171 Å) channels. The red/blue contours outline magnetic fields of +/−100, 300, 500 G. a) Composite of 1600 Å and downflow tracks. b) 171 Å base difference image showing the downflow filaments. c), d) 171 Å base-difference images of the impact, scaled between ± 300 DN s-1. The base image was at 07:10:00 UT. The red arrow points to the impacting filament and the white arrow points to an earlier impact that seems to have affected the structure of this impact. The evolution of the impact is shown in the movie.
Current usage metrics show cumulative count of Article Views (full-text article views including HTML views, PDF and ePub downloads, according to the available data) and Abstracts Views on Vision4Press platform.
Data correspond to usage on the plateform after 2015. The current usage metrics is available 48-96 hours after online publication and is updated daily on week days.
Initial download of the metrics may take a while.