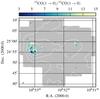
Fig. 9
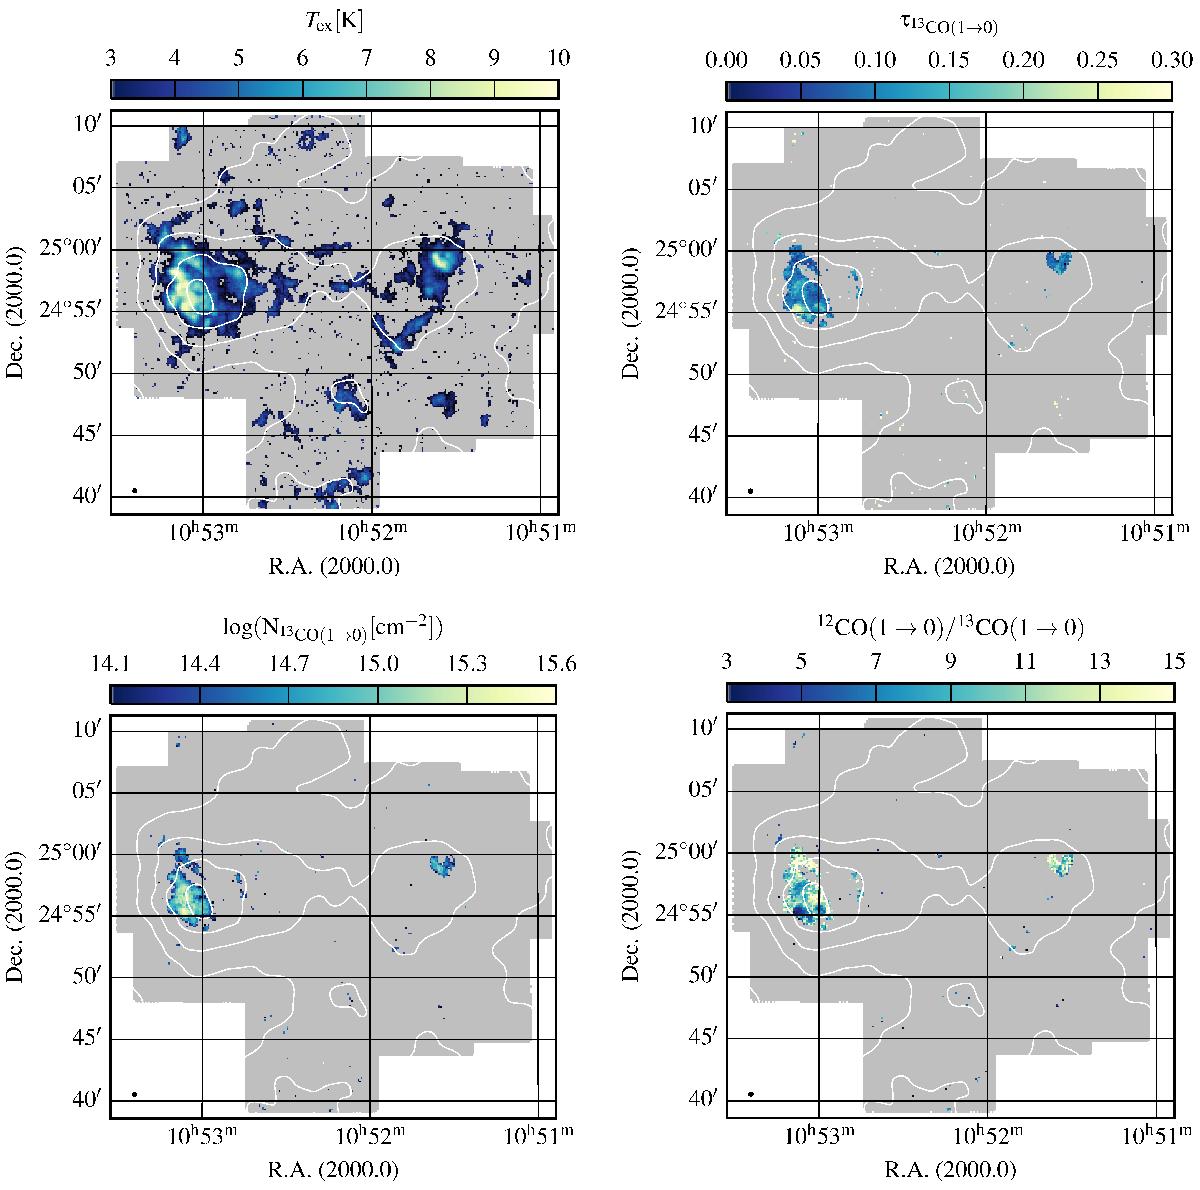
Excitation temperature Tex (top-left), the optical depth ![]() (top-right), the column density
(top-right), the column density ![]() (bottom-left), and the peak intensity ratios 12CO/13CO (bottom-right) of the mIVC. The contours mark the dust optical depth from Planck from 1 × 10⁻⁶ to 9 × 10⁻⁶ in steps of 2 × 10⁻⁶. At the bottom left the beam size of the IRAM 13CO(1 → 0) data is plotted.
(bottom-left), and the peak intensity ratios 12CO/13CO (bottom-right) of the mIVC. The contours mark the dust optical depth from Planck from 1 × 10⁻⁶ to 9 × 10⁻⁶ in steps of 2 × 10⁻⁶. At the bottom left the beam size of the IRAM 13CO(1 → 0) data is plotted.
Current usage metrics show cumulative count of Article Views (full-text article views including HTML views, PDF and ePub downloads, according to the available data) and Abstracts Views on Vision4Press platform.
Data correspond to usage on the plateform after 2015. The current usage metrics is available 48-96 hours after online publication and is updated daily on week days.
Initial download of the metrics may take a while.