Fig. 8
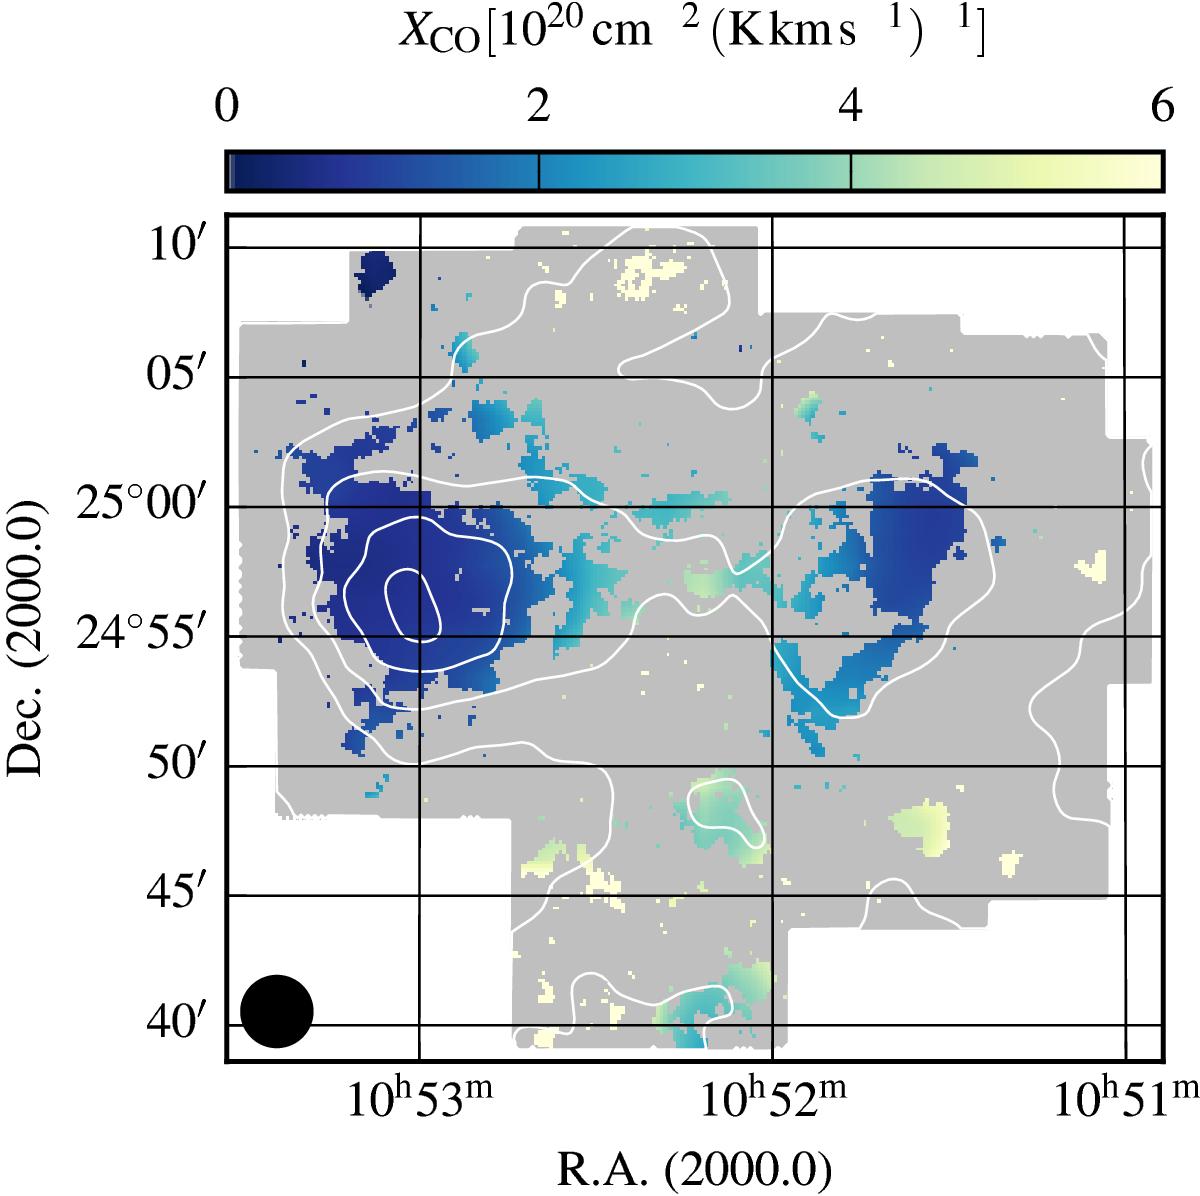
XCO map of the mIVC at the locations of detected 12CO(1 → 0) emission. The contours mark the modelled dust optical depth from Planck from 1 × 10⁻⁶ to 9 × 10⁻⁶ in steps of 2 × 10⁻⁶. The values range between 0.5 × 1020 cm-2 (K km s-1)-1 ≲ XCO ≲ 11 × 1020 cm-2 (K km s-1)-1. We note that the XCO map is derived at the angular resolution of the Planck data, which is shown at the bottom-left.
Current usage metrics show cumulative count of Article Views (full-text article views including HTML views, PDF and ePub downloads, according to the available data) and Abstracts Views on Vision4Press platform.
Data correspond to usage on the plateform after 2015. The current usage metrics is available 48-96 hours after online publication and is updated daily on week days.
Initial download of the metrics may take a while.