Fig. 5
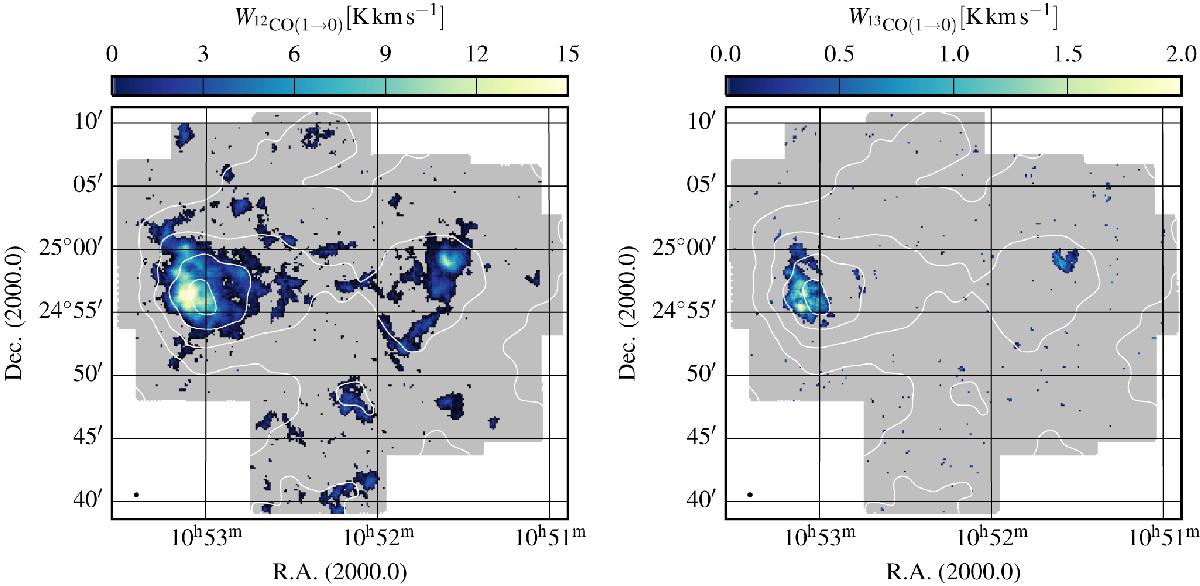
Moment maps of the 12CO(1 → 0) (left) and 13CO(1 → 0) emission (right) of the mIVC integrated between −45.8 km s-1 ≲ vLSR ≲ −33.1 km s-1. Before integration, the data cubes are masked using a spatially and spectrally smoothed version of the data cube as a mask. The contours mark the modelled dust optical depth from Planck from 1 × 10⁻⁶ to 9 × 10⁻⁶ in steps of 2 × 10⁻⁶. The beam-sizes are plotted at the bottom left corner.
Current usage metrics show cumulative count of Article Views (full-text article views including HTML views, PDF and ePub downloads, according to the available data) and Abstracts Views on Vision4Press platform.
Data correspond to usage on the plateform after 2015. The current usage metrics is available 48-96 hours after online publication and is updated daily on week days.
Initial download of the metrics may take a while.