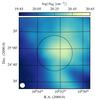
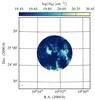
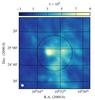
Fig. 4
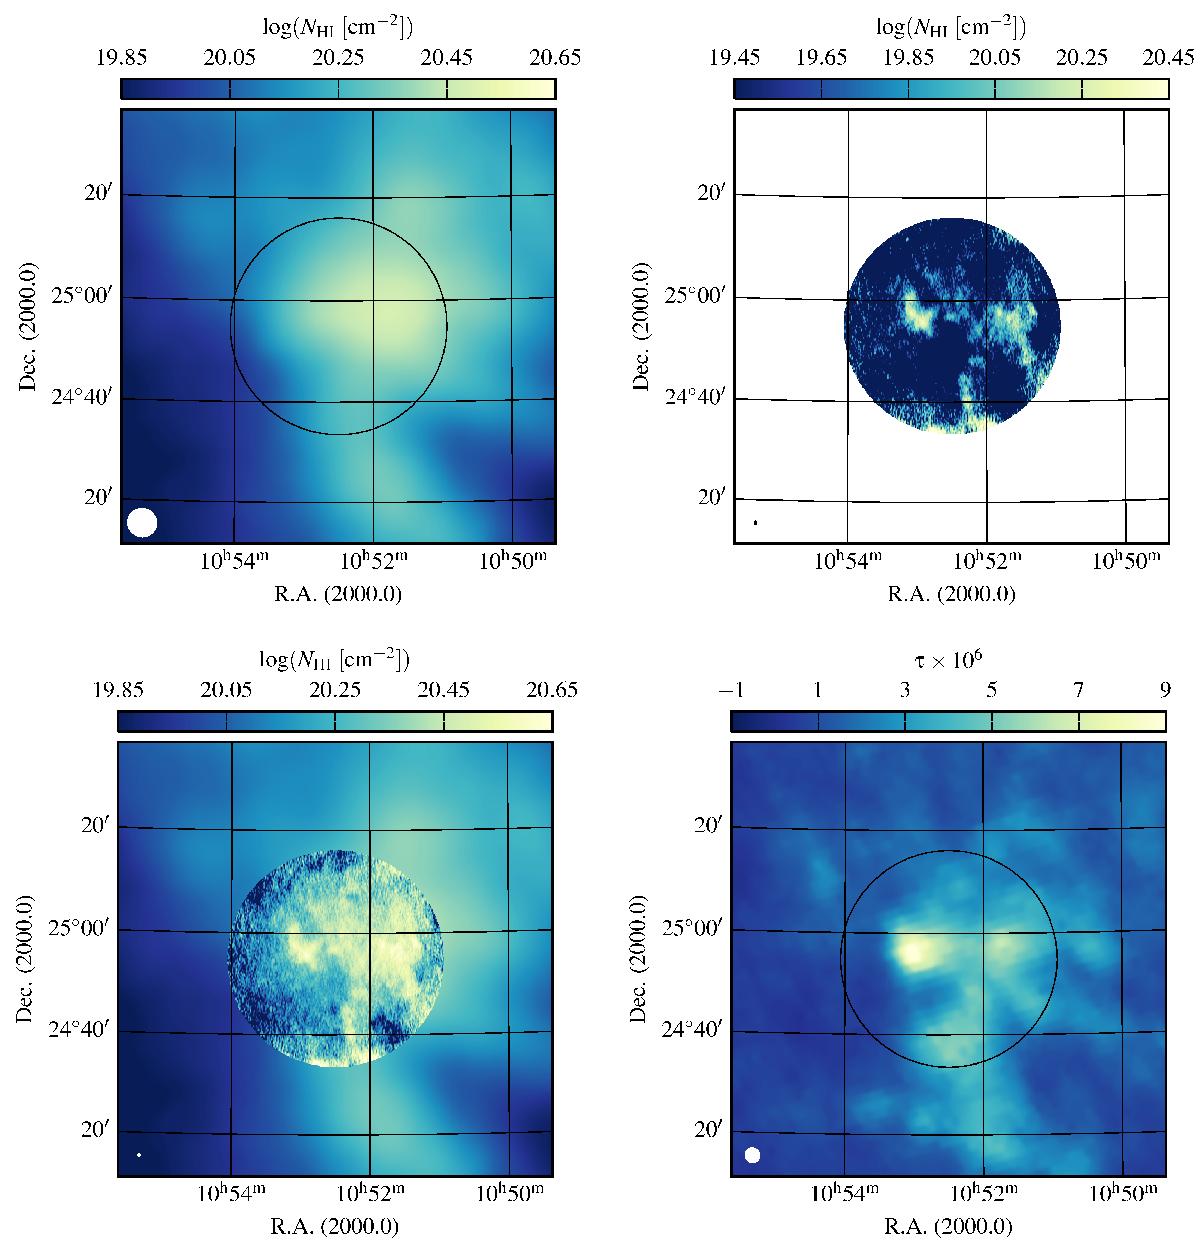
HI column density maps of the mIVC for EBHIS (top left), WSRT (top right), and the combined HI map (bottom left). The column densities are calculated for channels with −56.5 km s-1 ≲ vLSR ≲ −20.4 km s-1. At the bottom right the Planck τ data is shown. The black circle marks the position and extent of the WSRT pointing. The colour-scaling is the same for the EBHIS and the combined map. The beam size of each map is given in the bottom-left corner.
Current usage metrics show cumulative count of Article Views (full-text article views including HTML views, PDF and ePub downloads, according to the available data) and Abstracts Views on Vision4Press platform.
Data correspond to usage on the plateform after 2015. The current usage metrics is available 48-96 hours after online publication and is updated daily on week days.
Initial download of the metrics may take a while.