Fig. 8
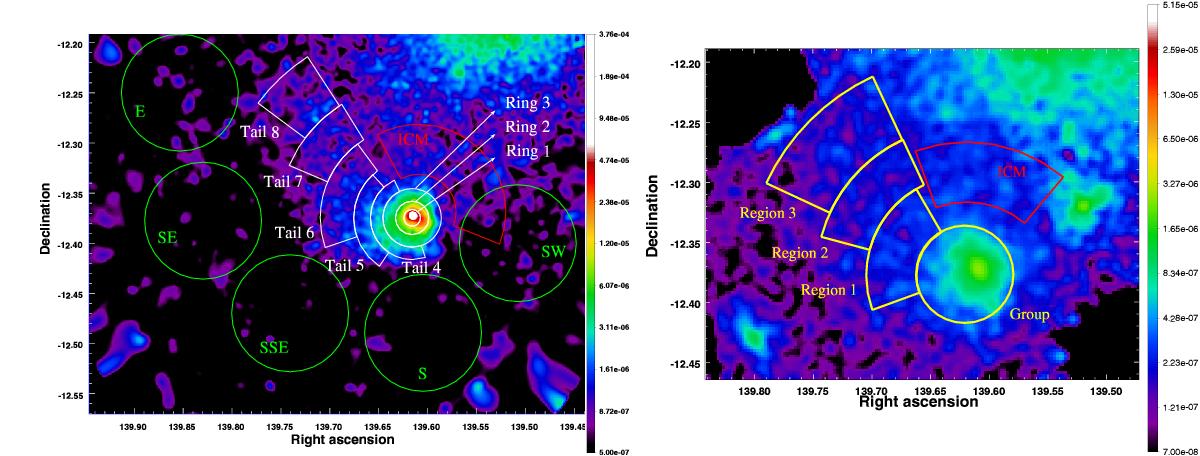
Left panel: XMM-Newton image of the LEDA 87445 group with the extraction regions used for the spectral analysis. White regions are chosen to match the LEDA group and its long tail of faint emission, the red sector is used to measure the ICM temperature nearby the group, and the green circles are used to estimate the surface brightness of the ICM at various positions around LEDA. Right panel: Suzaku image of the LEDA group with, in yellow and red, the regions used for the spectral analysis of the structure and ICM, respectively. In both panels the labels of the regions are the same used in Tables 1 and 2 reporting the spectral analysis results.
Current usage metrics show cumulative count of Article Views (full-text article views including HTML views, PDF and ePub downloads, according to the available data) and Abstracts Views on Vision4Press platform.
Data correspond to usage on the plateform after 2015. The current usage metrics is available 48-96 hours after online publication and is updated daily on week days.
Initial download of the metrics may take a while.