Free Access
Fig. 4
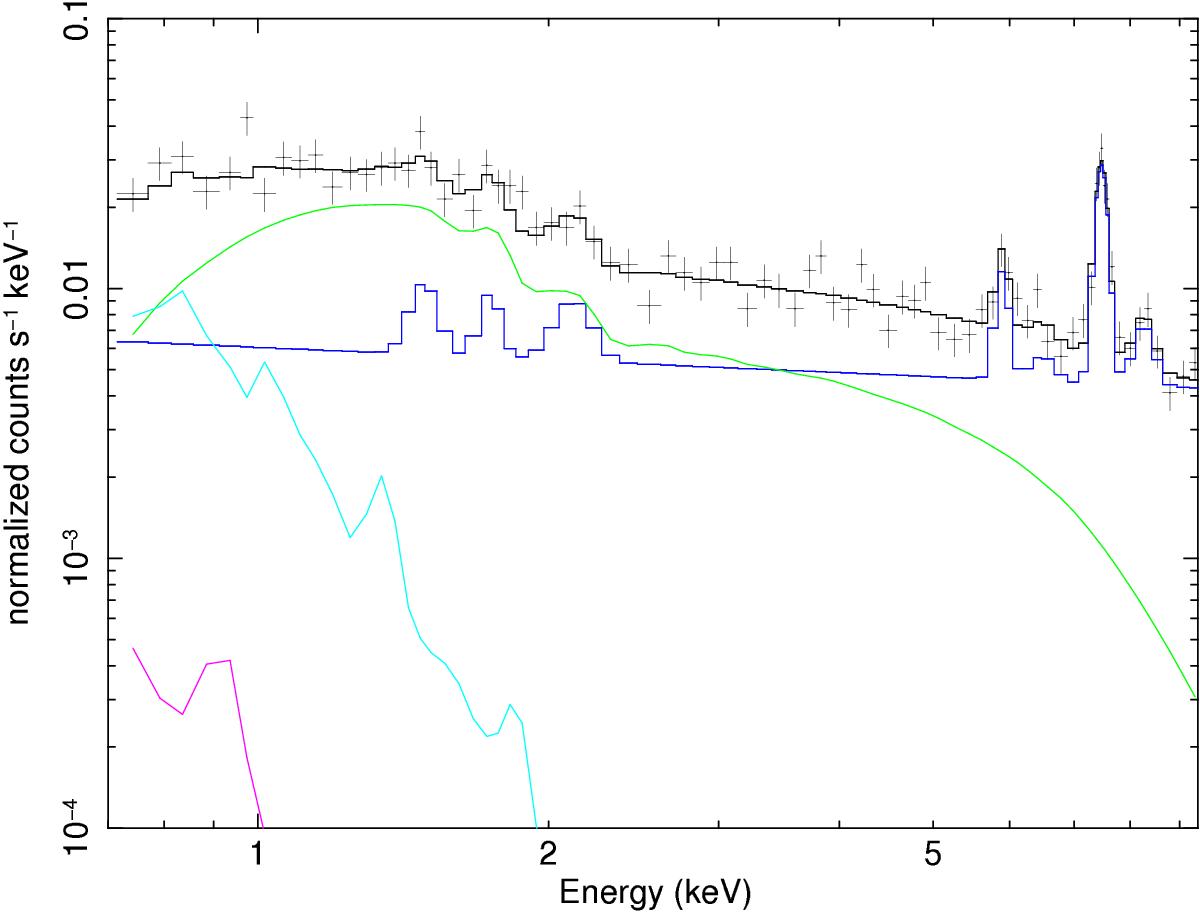
Suzaku front-illuminated spectrum of the background region shown in Fig. 3 and best-fit model (black line). The dark blue curve shows the NXB model, while the sky background components are shown in green (CXB), cyan (Galactic halo), and purple (local bubble).
Current usage metrics show cumulative count of Article Views (full-text article views including HTML views, PDF and ePub downloads, according to the available data) and Abstracts Views on Vision4Press platform.
Data correspond to usage on the plateform after 2015. The current usage metrics is available 48-96 hours after online publication and is updated daily on week days.
Initial download of the metrics may take a while.