Fig. 3
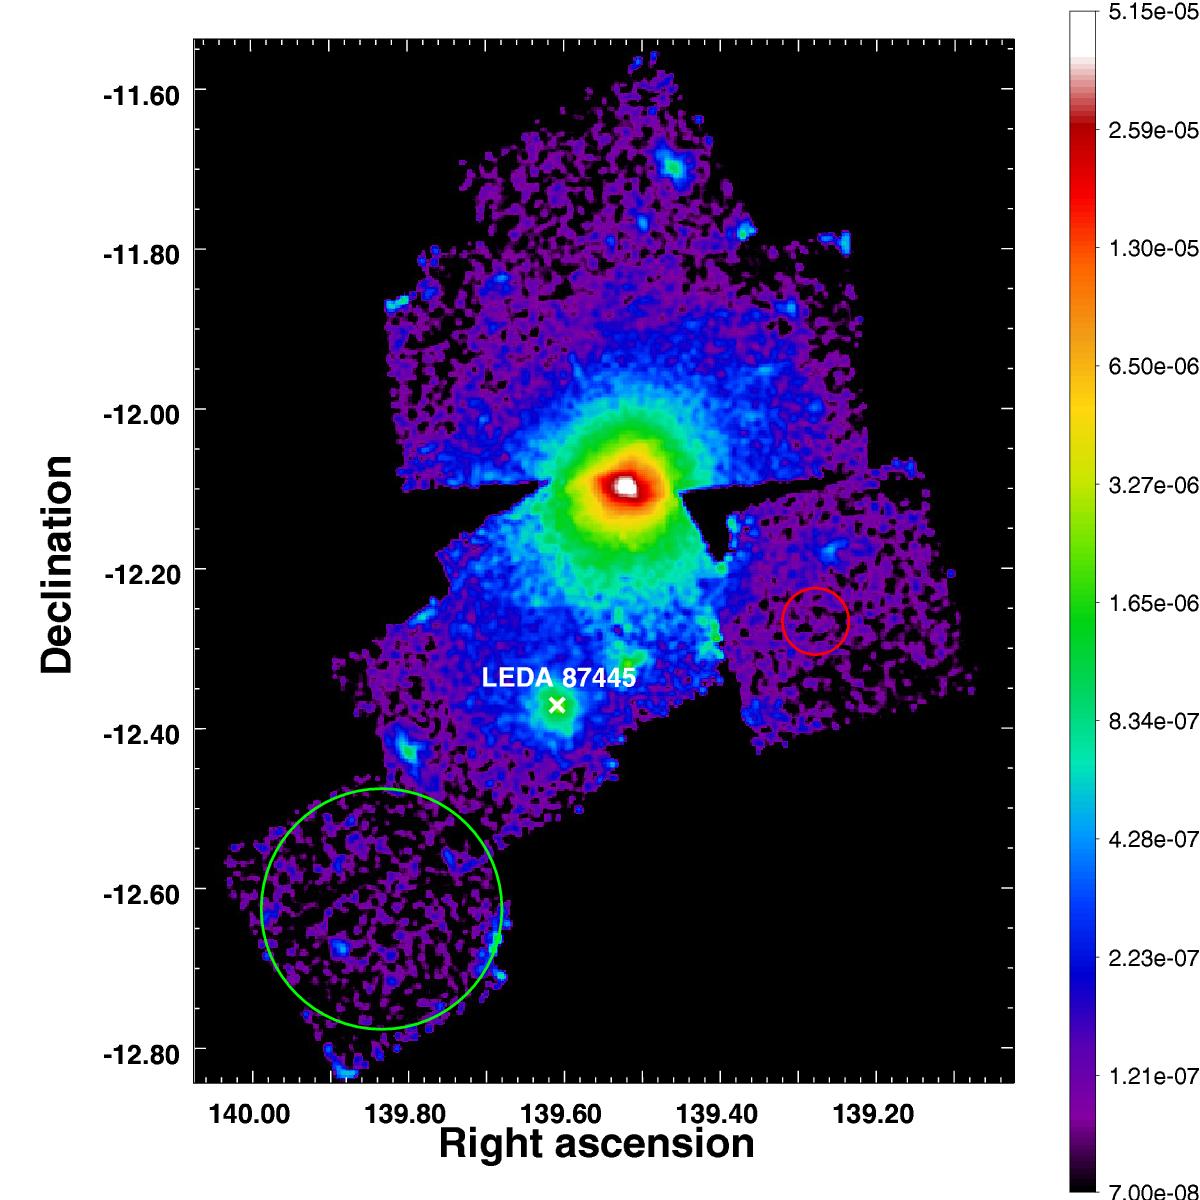
Exposure-corrected Suzaku/XIS mosaic image of Hydra A combining all seven available pointings. The LEDA 87445 group is highlighted in white. The green circle indicates the background region on the off-source pointing used for this analysis. The red circle is a region used to measure the ICM temperature of Hydra A; details are given in Sect. 3.2.
Current usage metrics show cumulative count of Article Views (full-text article views including HTML views, PDF and ePub downloads, according to the available data) and Abstracts Views on Vision4Press platform.
Data correspond to usage on the plateform after 2015. The current usage metrics is available 48-96 hours after online publication and is updated daily on week days.
Initial download of the metrics may take a while.