Fig. 2
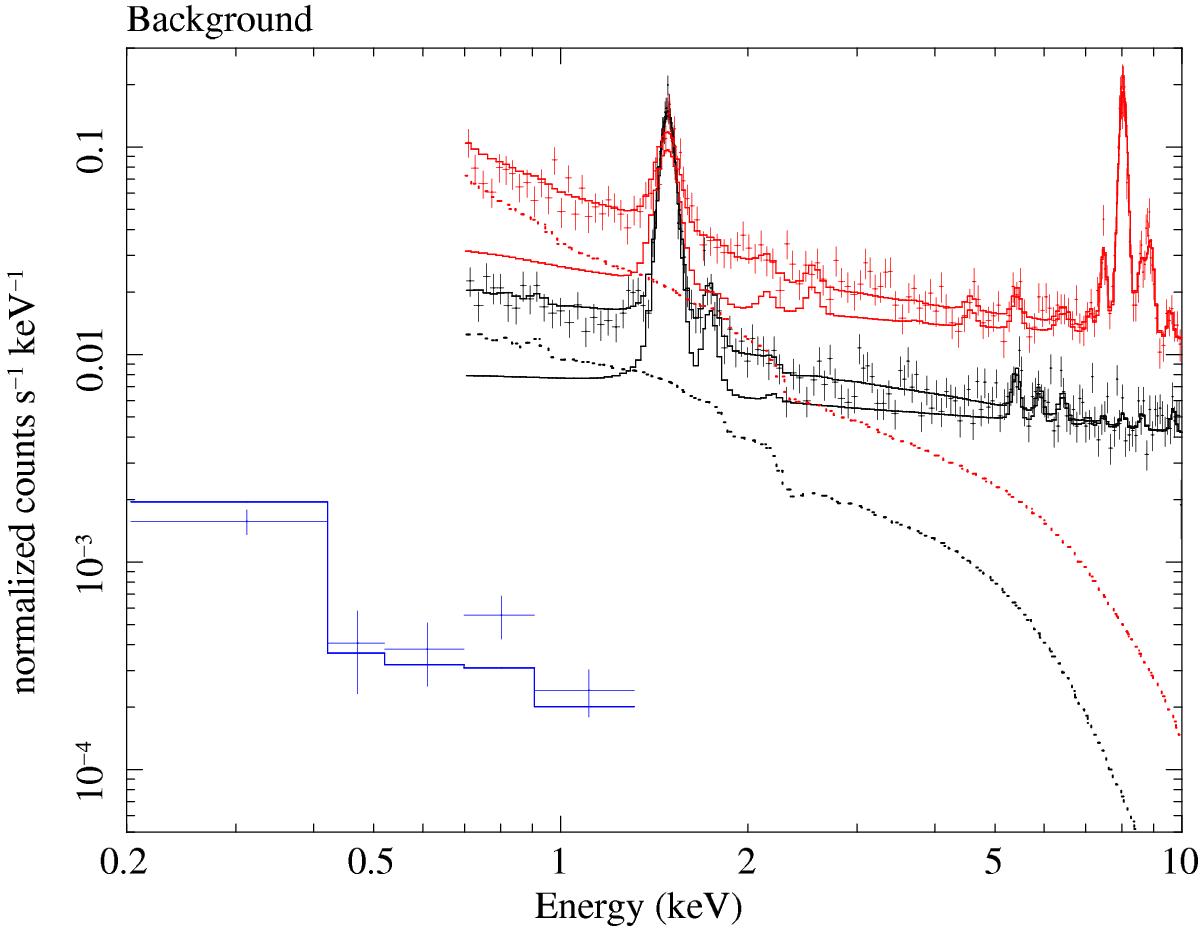
Spectrum of the background region located at 25.5 arcmin SE of the cluster core used to measure the sky background components from the EPIC pn (red), MOS2 (black; MOS1 was omitted for clarity), and from the ROSAT/PSPC (blue). The solid lines show the NXB model for each instrument, while the dotted lines show the sky background model.
Current usage metrics show cumulative count of Article Views (full-text article views including HTML views, PDF and ePub downloads, according to the available data) and Abstracts Views on Vision4Press platform.
Data correspond to usage on the plateform after 2015. The current usage metrics is available 48-96 hours after online publication and is updated daily on week days.
Initial download of the metrics may take a while.