Free Access
Fig. A.1
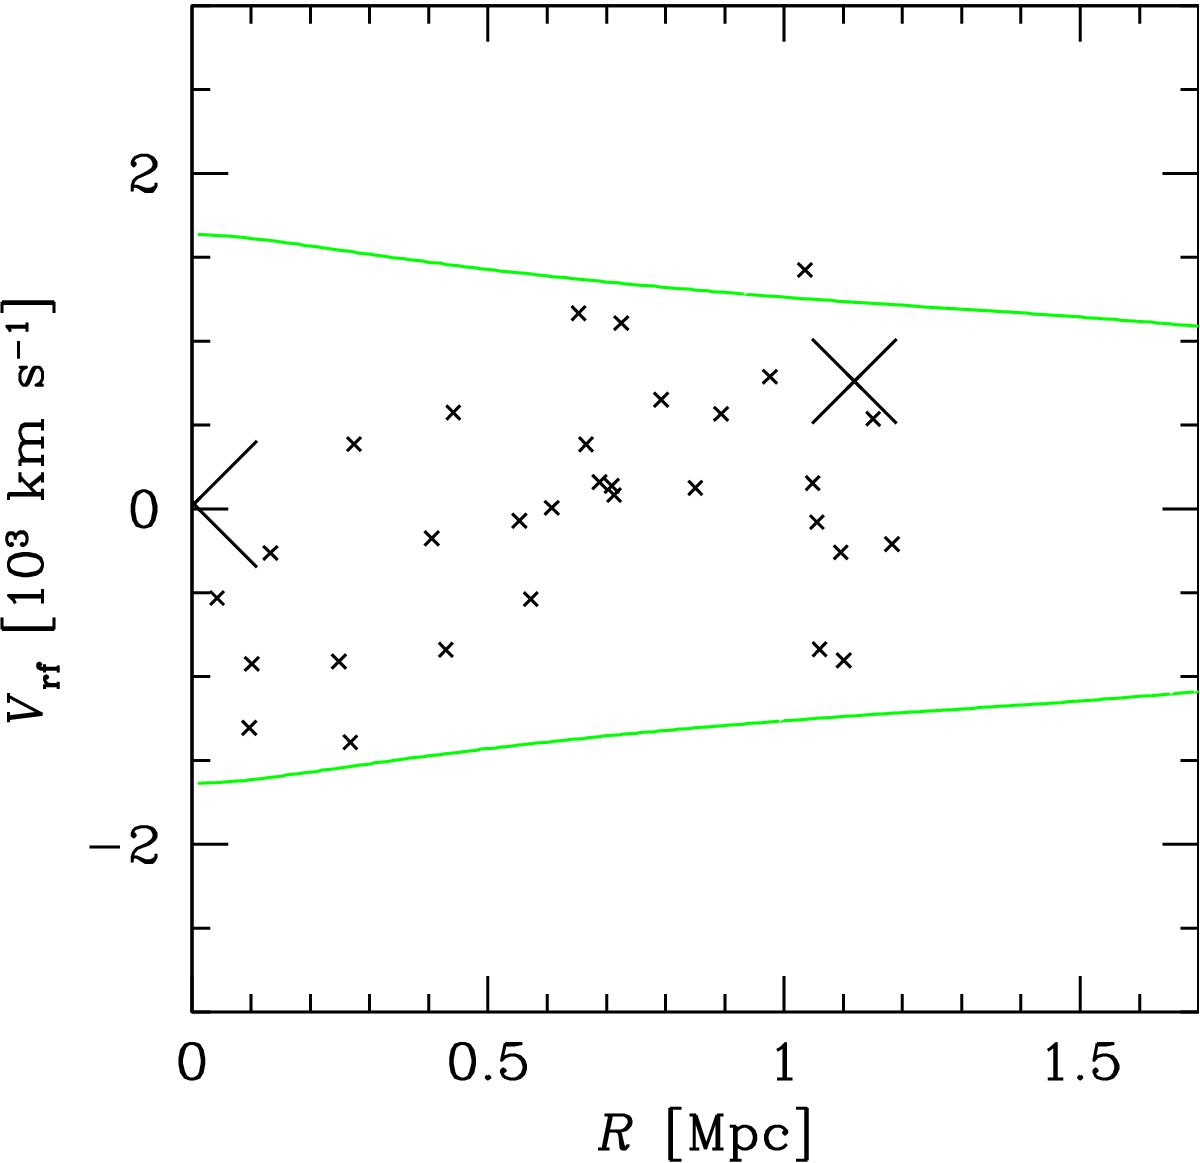
Rest-frame velocity Vrf = (V− ⟨ V ⟩ ) / (1 + z) vs. projected clustercentric distance R for the 33 cluster members. Crosses indicate the BGC (centre) and LEDA 87445. Curves contain the region of Vrf smaller than the escape velocity. The curves show the limit due to the escape velocity in the cluster.
Current usage metrics show cumulative count of Article Views (full-text article views including HTML views, PDF and ePub downloads, according to the available data) and Abstracts Views on Vision4Press platform.
Data correspond to usage on the plateform after 2015. The current usage metrics is available 48-96 hours after online publication and is updated daily on week days.
Initial download of the metrics may take a while.