Free Access
Fig. 13
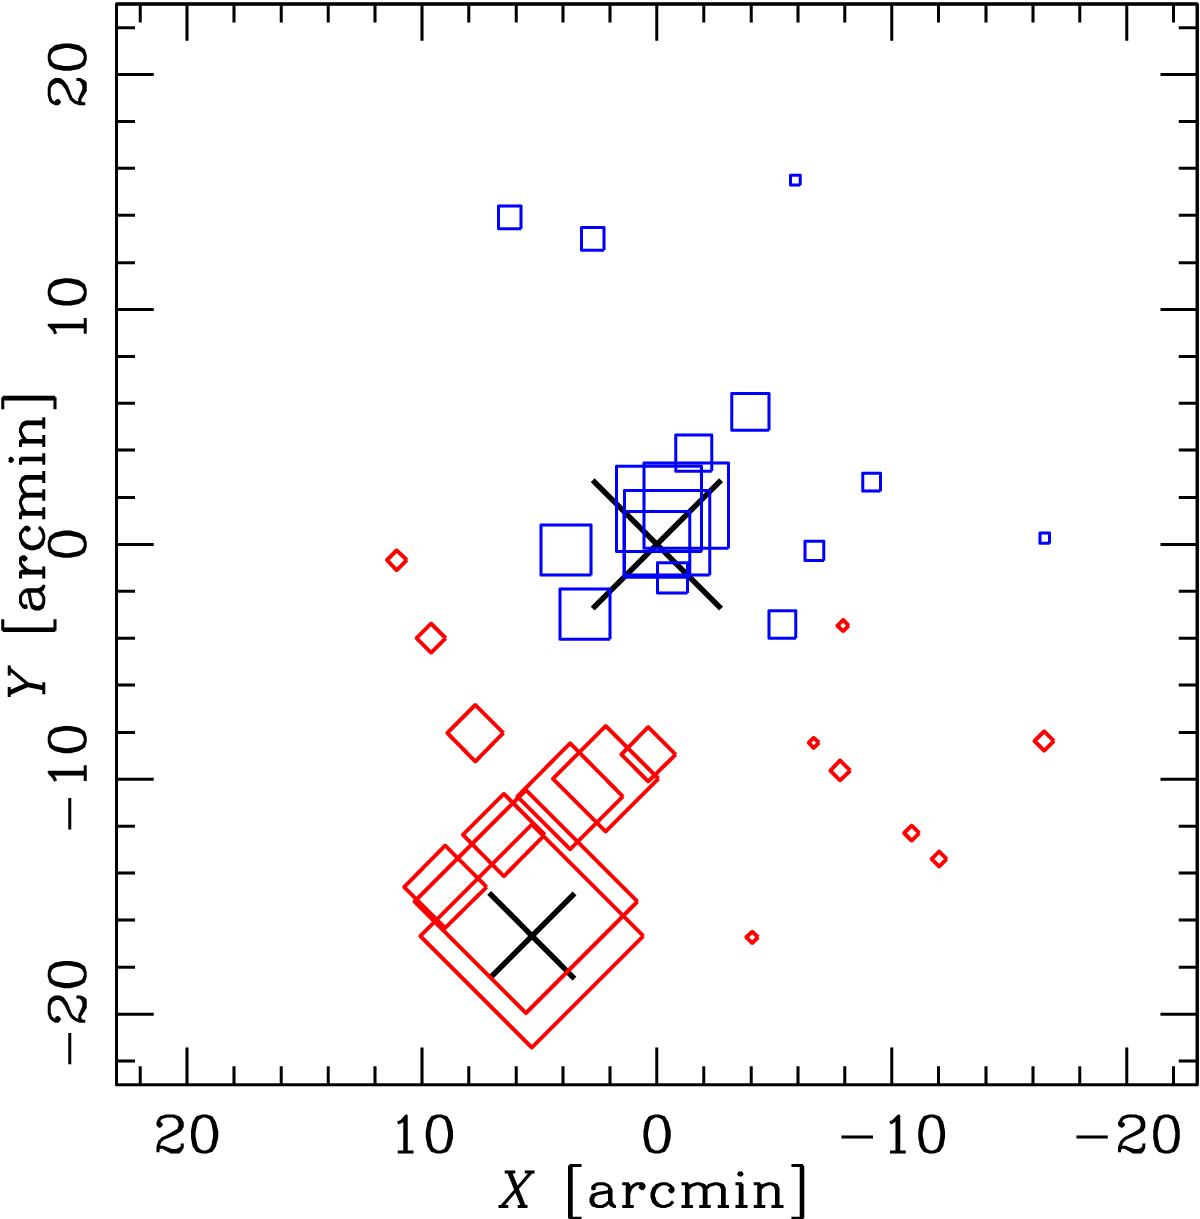
DS⟨V⟩ bubble plot for the 33 cluster members. The larger the symbol, the larger the deviation of the local mean velocity from the global mean velocity. Blue squares indicate negative deviations and red rotate squares positive deviations. Crosses indicate the BGC (centre) and LEDA 87445.
Current usage metrics show cumulative count of Article Views (full-text article views including HTML views, PDF and ePub downloads, according to the available data) and Abstracts Views on Vision4Press platform.
Data correspond to usage on the plateform after 2015. The current usage metrics is available 48-96 hours after online publication and is updated daily on week days.
Initial download of the metrics may take a while.