Fig. 11
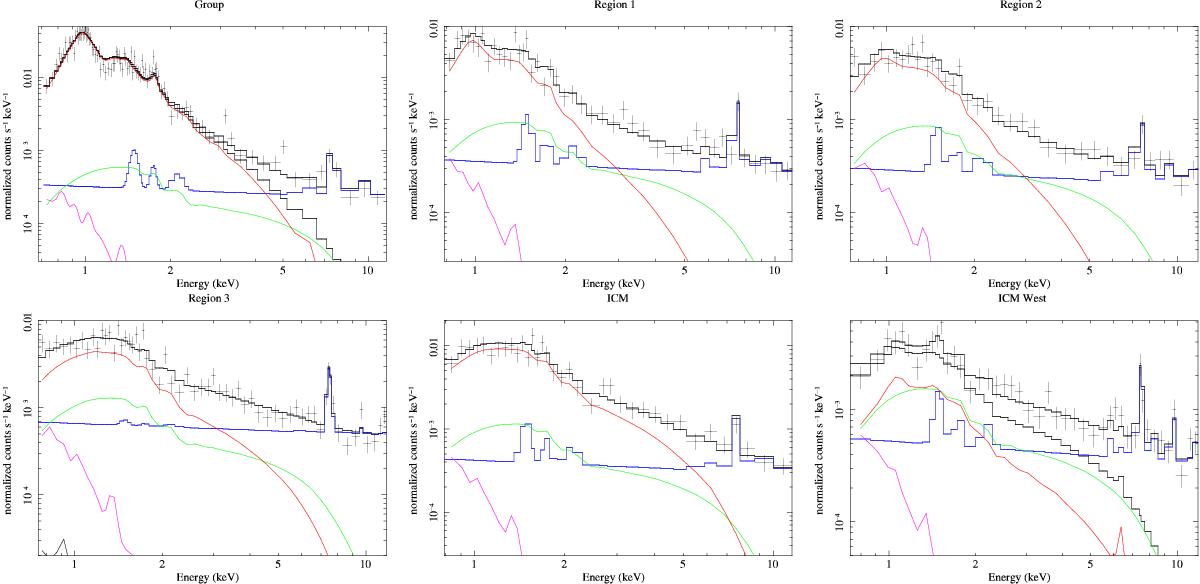
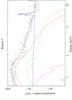
Suzaku/XIS spectra of the subgroup. The fit was performed using all three XIS detectors, however for clarity purposes we only plot the spectra of the sum of the two FI units (XIS0+XIS3) and their spectral components. The solid lines show the various components used for the fitting procedure; the colour code for the different spectral components is the same as in Fig. 10. The last two panels are the spectrum of the local ICM. The panel labelled ICM refers to the region close to the tip of the infalling group and shown in Fig. 8 (right panel); the panel labelled ICM-SW is the measure in the circular region shown in red in Fig. 3.

Current usage metrics show cumulative count of Article Views (full-text article views including HTML views, PDF and ePub downloads, according to the available data) and Abstracts Views on Vision4Press platform.
Data correspond to usage on the plateform after 2015. The current usage metrics is available 48-96 hours after online publication and is updated daily on week days.
Initial download of the metrics may take a while.