Fig. B.1
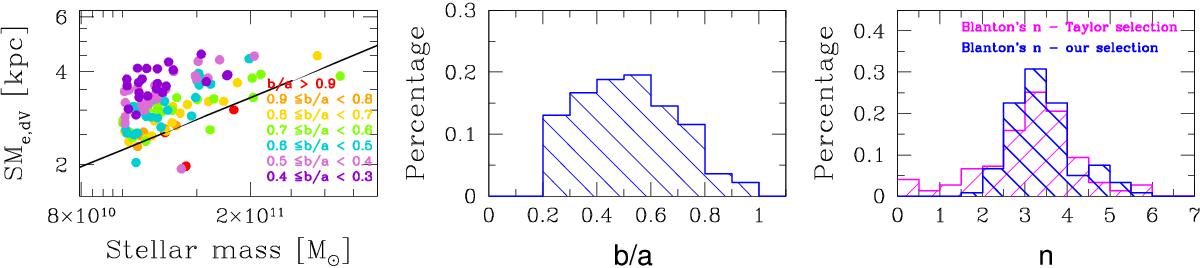
Left panel: sample of local dense galaxies selected using the Taylor et al.’s cuts and circularized de Vaucouleur radius Re,dV, and plotted in the size-mass plane using their semi-major de Vaucouleur axis SMe,dV. Galaxies are colour coded according to their b/a ratio, as declared in the labels. Solid line indicates the log(Re,dV/kpc) = 0.56 × (log(M⋆/M⊙) −9.84)−0.3 relation. Central panel: the distribution of the axis ratio b/a for the same galaxies in the left panel. Histogram counts are normalized to unity. Right panel: the distribution of the Sersic index n of local dense galaxies selected using the Taylor et al. cuts and circularized Sersic radius (blue histogram). Histogram counts are normalized to unity. Magenta histogram is the distribution of the Sersic index for our sample of ultramassive dense ETGs.
Current usage metrics show cumulative count of Article Views (full-text article views including HTML views, PDF and ePub downloads, according to the available data) and Abstracts Views on Vision4Press platform.
Data correspond to usage on the plateform after 2015. The current usage metrics is available 48-96 hours after online publication and is updated daily on week days.
Initial download of the metrics may take a while.