Fig. A.2
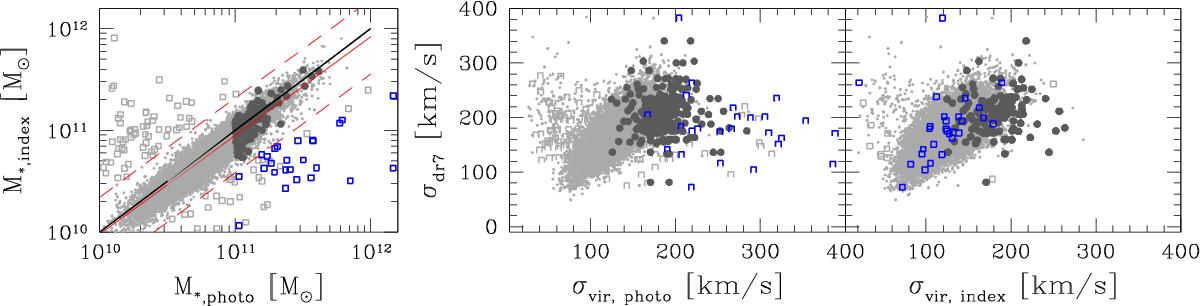
Left panel: stellar mass derived through the fit of the multiband photometry (used in this paper, M⋆,photo) vs. that obtained fitting the spectral indices (M⋆,index, Kauffmann et al. 2003) for local ETGs at 0.05 <z< 0.1 (light grey points). Black solid line is the 1:1 correlation, while red line is the best-fit relation and red-dotted curves are the 3σ lines. All of the points at >3σ are indicated as open squares. Among these outliers, blue squares are those with M⋆> 1011M⊙, and Σ > 2500 M⊙ pc-2, i.e. nominally included in local sample of ultramassive dense local ETGs. Dark grey points are the remaining part of the ultramassive dense local ETGs. Central panel: the measured velocity dispersion (σdr7) vs. the velocity dispersion derived from the virial theorem assuming the M⋆,photo values as mass (σvir,photo). Right panel: the same of central panel but with σvir derived assuming the M⋆,index values.
Current usage metrics show cumulative count of Article Views (full-text article views including HTML views, PDF and ePub downloads, according to the available data) and Abstracts Views on Vision4Press platform.
Data correspond to usage on the plateform after 2015. The current usage metrics is available 48-96 hours after online publication and is updated daily on week days.
Initial download of the metrics may take a while.