Fig. 5
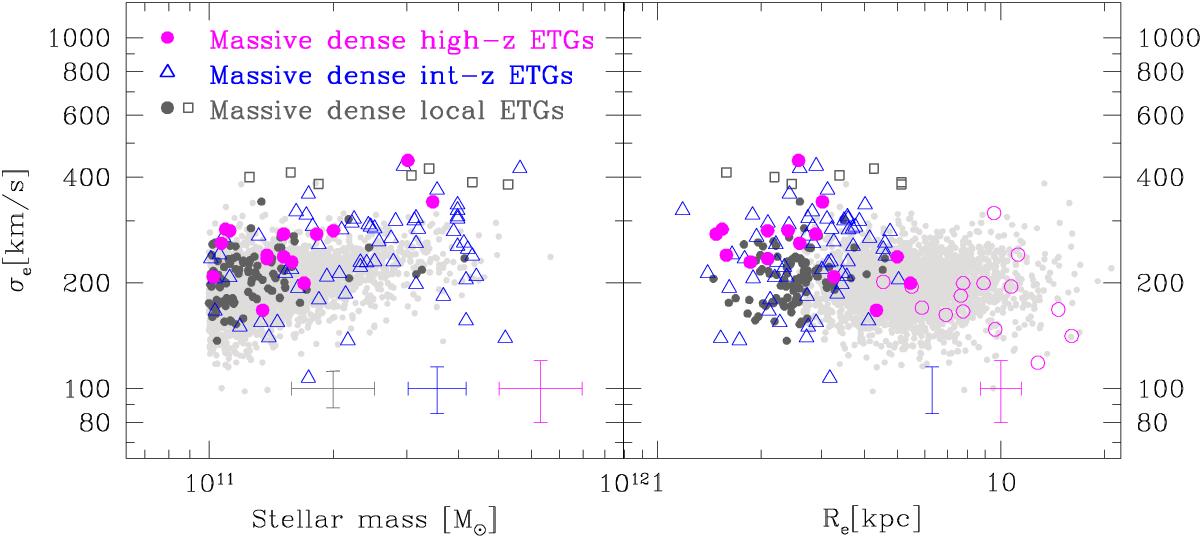
Comparison between the structural and dynamical properties of ultramassive dense ETGs over the last ~10 Gyr. Magenta points indicate dense ETGs at 1.2 ≲ z< 1.6, open blue triangles indicate dense ETGs at 0.3 ≲ z ≲ 0.9, and local ETGs are shown with dark grey small dots. Light grey points are the whole sample of local ETGs with M⋆> 1011M⊙, thus with no cut in mean stellar mass density. Grey open squares indicate the local ultramassive dense galaxies selected from the sample of local galaxies with velocity dispersion >350 km s-1 by Bernardi et al. (2008), while open magenta circles show high-z ETGs evolved in size a factor ~3, as predicted by the relation ⟨ Re ⟩ ∝ (1 + z)-1.5and in σ according to the merger scenario by (Hopkins et al. 2009). In each panel, average error bars are reported. They are colour coded according to the sample they refer. For what concerns the high-z sample, we have found that on average δRe/Re ~ 11%, δσe/σe~10% (see Tables 3 and 4), while we have assumed a typical uncertainty of 20% on M⋆. At intermediate redshift, δRe/Re~10%, δσe/σe ~ 7%, and δM⋆ = 0.10 dex (see Saglia et al. 2010). In local Universe, δM⋆ = 0.07 dex (see Salim et al. 2007), δσe/σe ~ 10%, and we assume δRe/Re ~ 15%. For the error on local Re we refer to La Barbera et al. (2010) which derive the structural parameters of SDSS galaxies on SDSS images using 2DPHOT. In fact, the errors on parameters are expected to be mainly driven by the characteristics of the images, and not by the software and/or procedure used.
Current usage metrics show cumulative count of Article Views (full-text article views including HTML views, PDF and ePub downloads, according to the available data) and Abstracts Views on Vision4Press platform.
Data correspond to usage on the plateform after 2015. The current usage metrics is available 48-96 hours after online publication and is updated daily on week days.
Initial download of the metrics may take a while.