Fig. 4
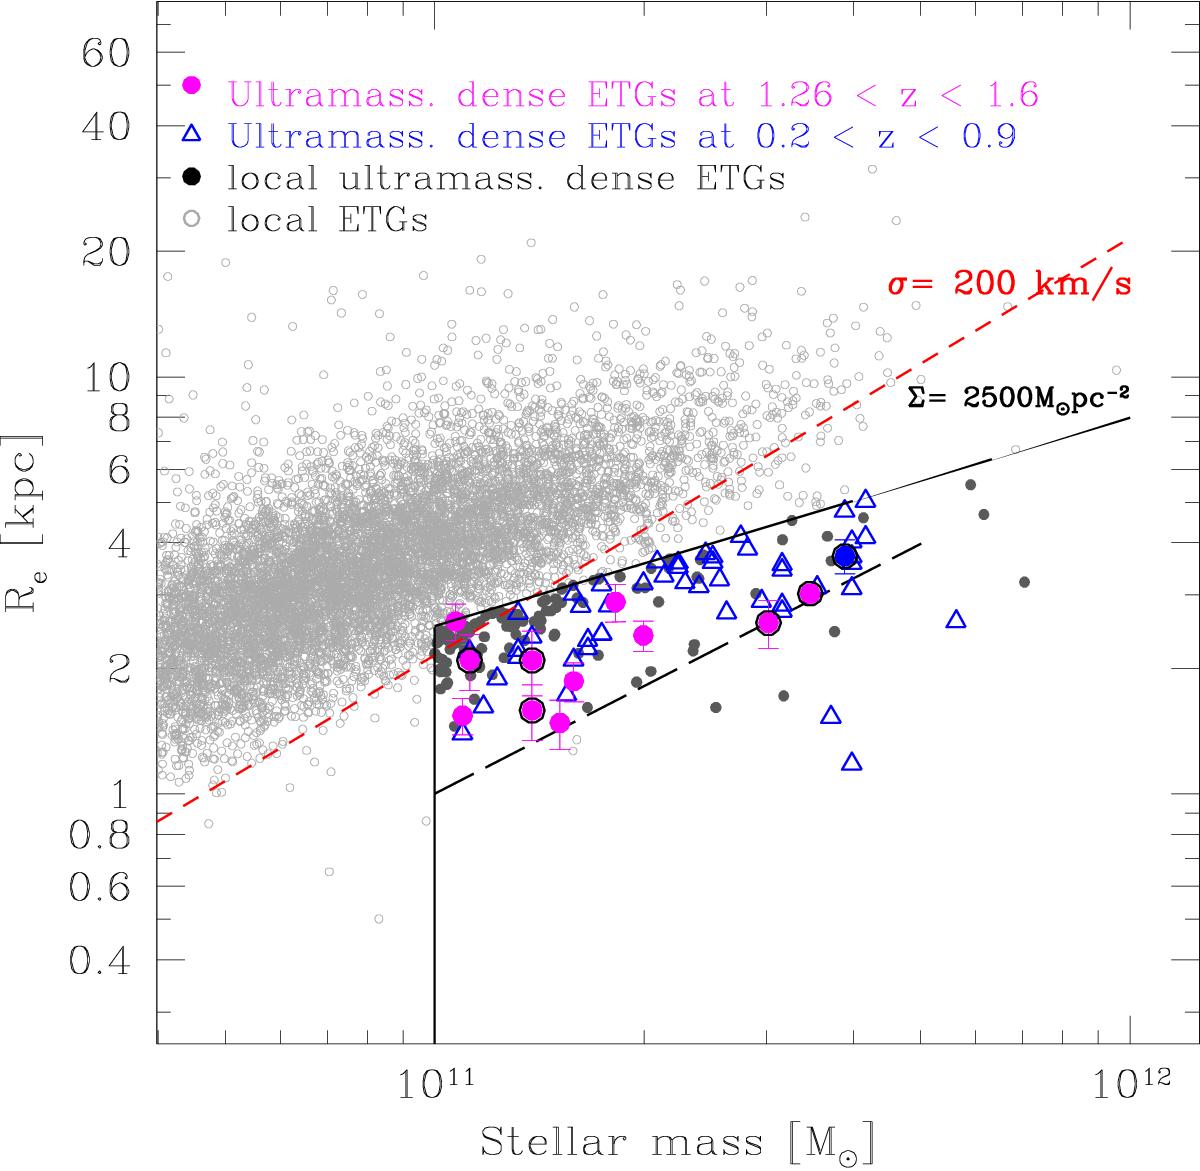
Distribution of the ultramassive dense ETGs from z ~ 1.6 to z ~ 0 in the Re–M⋆ plane. Ultramassive dense ETGs at 1.2 <z< 1.6 are represented with magenta filled circles. The ETGs from MUNICS sample with available velocity dispersion (five presented here and one in Longhetti et al. 2014) are indicated with black countours. The ETG of MUNICS sample at redshift 1.91 (hence not included in the analysis of Sect. 3.3) is indicated with a blue point. Ultramassive dense ETGs at 0.3 <z< 0.9 and in the local Universe are indicated with blue open triangles and dark grey points, respectively. Solid black lines define the cuts in M⋆ and Σ of our samples. The small open circles show local ETGs from Thomas et al. (2010) in the redshift range 0.063 <z< 0.1. The red line indicates a line of constant σ derived as ![]() , i.e. assuming zero dark matter. The long-dashed line indicates the lower boundary of the size-mass relation as found by Belli et al. (2014) and van der Wel et al. (2014).
, i.e. assuming zero dark matter. The long-dashed line indicates the lower boundary of the size-mass relation as found by Belli et al. (2014) and van der Wel et al. (2014).
Current usage metrics show cumulative count of Article Views (full-text article views including HTML views, PDF and ePub downloads, according to the available data) and Abstracts Views on Vision4Press platform.
Data correspond to usage on the plateform after 2015. The current usage metrics is available 48-96 hours after online publication and is updated daily on week days.
Initial download of the metrics may take a while.