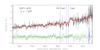
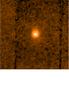
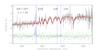
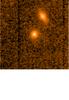
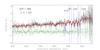
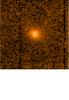
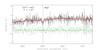
Fig. 3
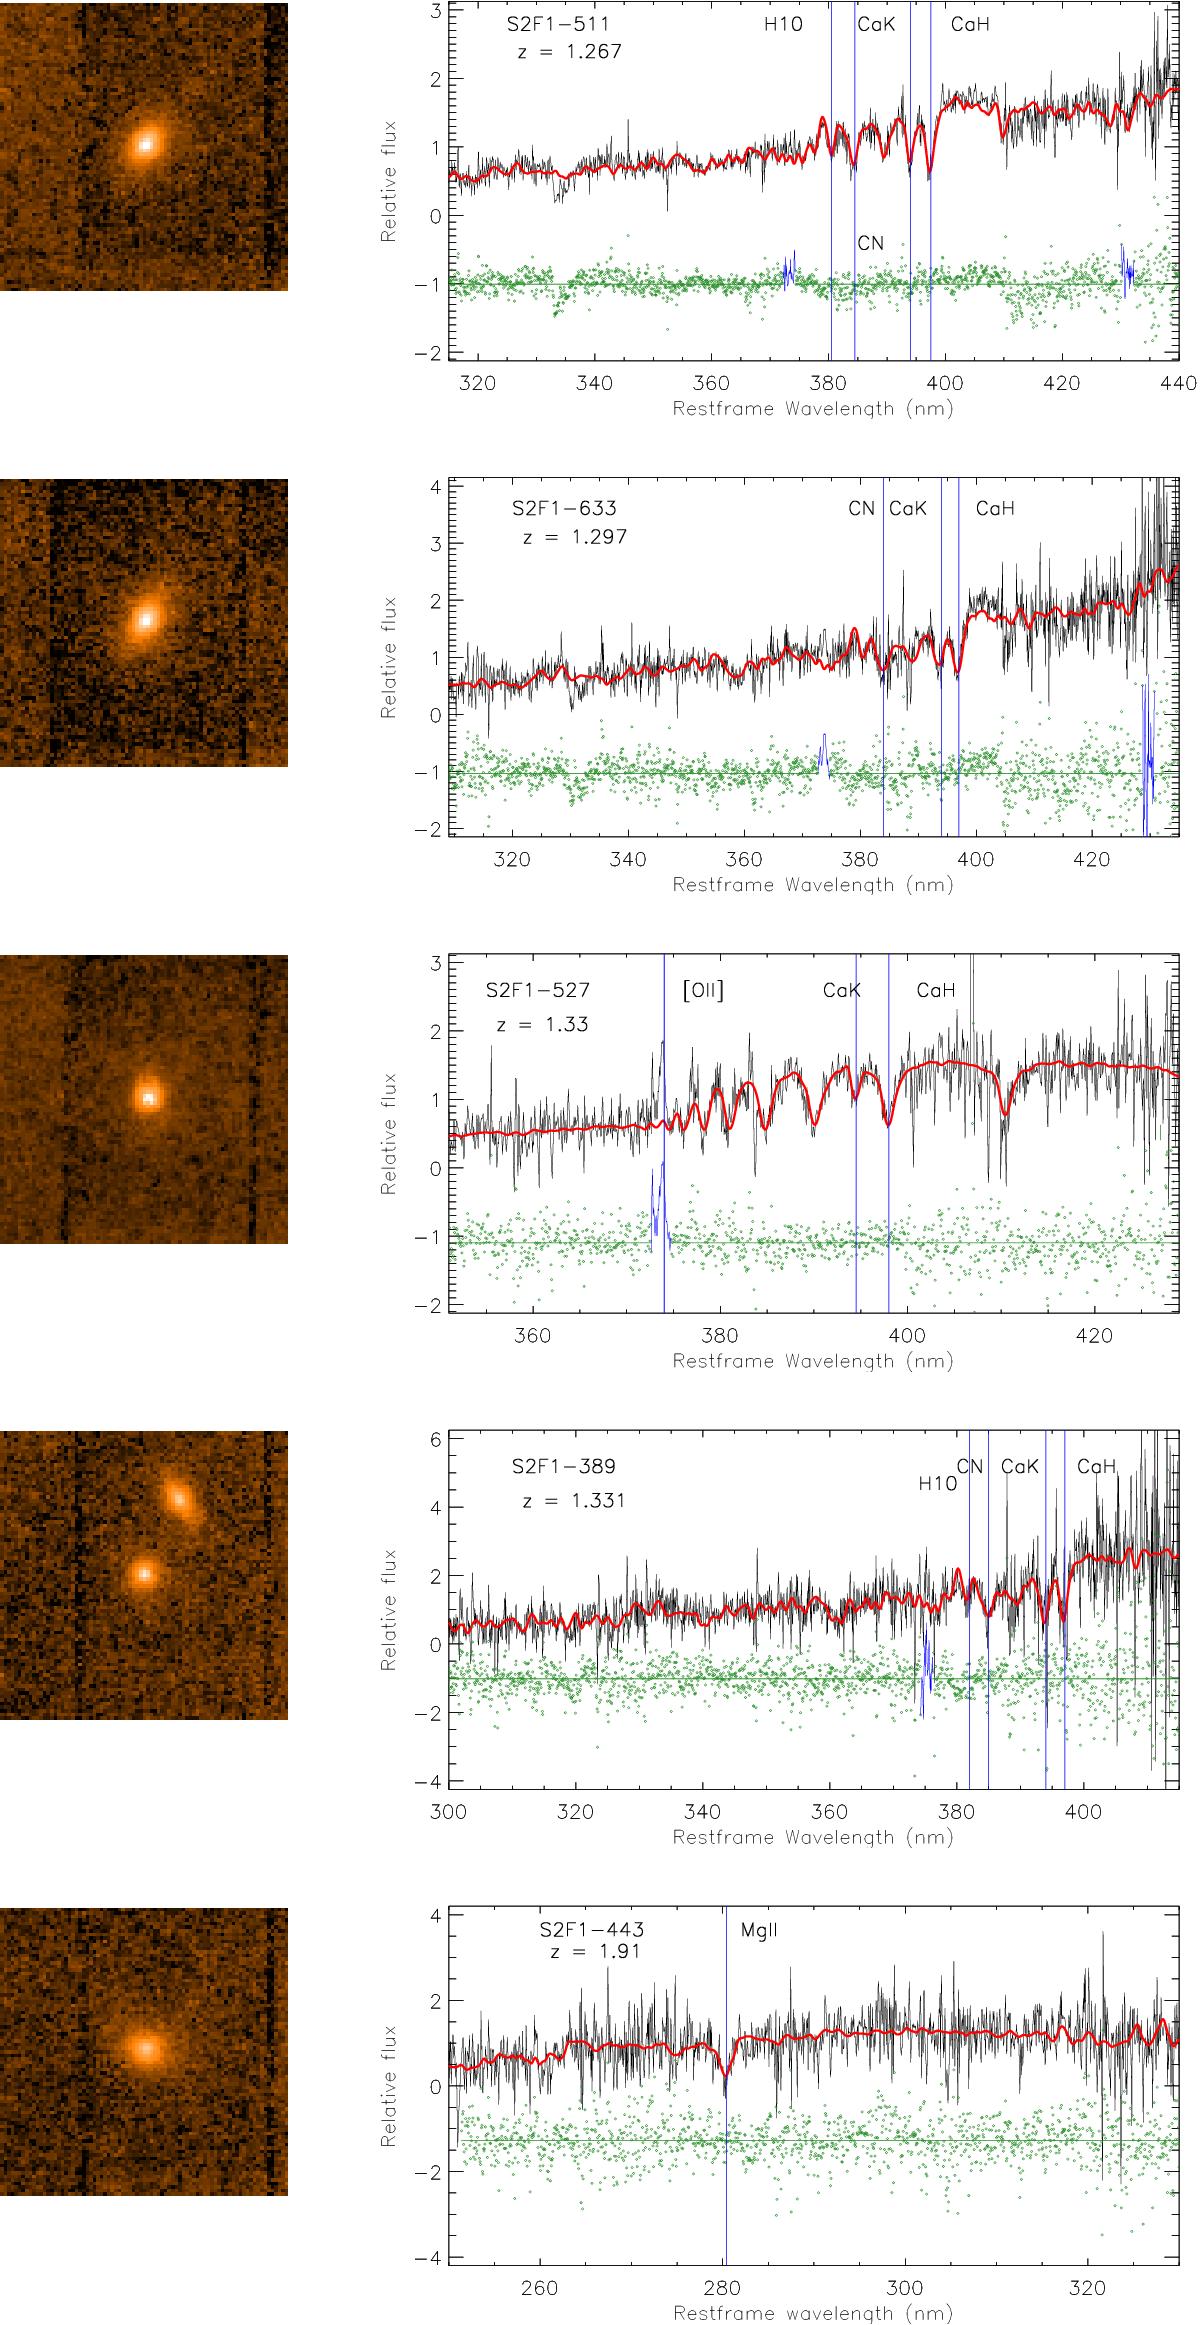
Left column: HST-NIC2/F160W images of the five ETGs of our high-z sample for which we present the VLT-FORS2 spectra (each image is 6×6 arcsec). Right column: spectra, unsmoothed and not-rebinned, of our five ETGs (black lines, 8 h of effective integration time). Many optical absorption features (blue lines) are clearly distinguishable from the continuum. The best-fit pPXF model is plotted in red. On average, pPXF selects and combines 2−4 star templates to reproduce the observed spectrum. Residuals after best-fit model subtraction are shown with green points. In the residual tracks, blue lines are the regions automatically excluded by the software pPXF as strongly affected by sky emission lines.
Current usage metrics show cumulative count of Article Views (full-text article views including HTML views, PDF and ePub downloads, according to the available data) and Abstracts Views on Vision4Press platform.
Data correspond to usage on the plateform after 2015. The current usage metrics is available 48-96 hours after online publication and is updated daily on week days.
Initial download of the metrics may take a while.