Fig. 2
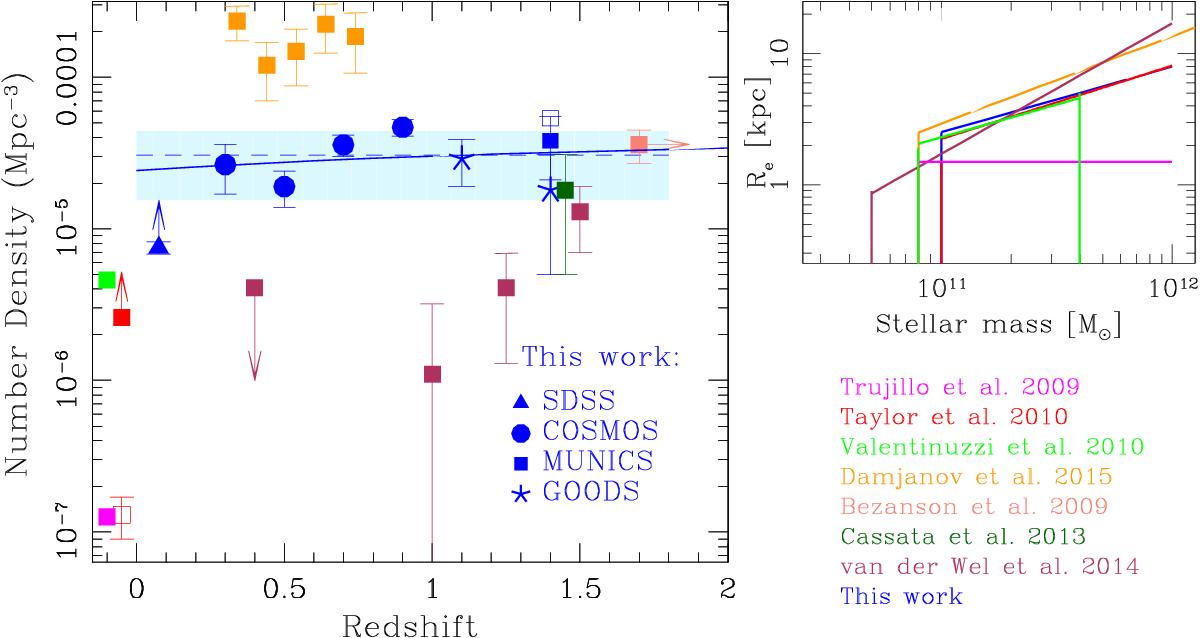
Left: evolution of the comoving number density of ultramassive dense ETGs (M⋆ > 1011M⊙, Σ > 2500 M⊙ pc-2) from redshift 1.6 to redshift ~0 (blue symbols). The open blue square indicates the number density of ultramassive dense MUNICS ETGs at ⟨ z ⟩ = 1.4 corrected for the spectroscopic incompleteness of the MUNICS survey (see text). Solid blue line is the best-fit relation to our data in the range 0.066 < z < 1.6 (ρ ∝ (1 + z)0.3), while the blue dotted line indicates the mean value over the redshift range 0.066 < z < 1.6 (the dashed area indicates the 1σ deviation around this value). The orange squares indicate the number density for ultramassive compact galaxies by Damjanov et al. (2015), the magenta square by Trujillo et al. (2009), the light green square by Valentinuzzi et al. (2010), the purple squares by van der Wel et al. (2014), the salmon squares by Bezanson et al. (2009), the dark green square by Cassata et al. (2013), and the open red square by Taylor et al. (2010a). The points by Taylor et al. (open red square) and Cassata et al. (dark green square) are derived selecting from their sample only the galaxies with M⋆ > 1011M⊙ (see Table 3). The filled red square is the number density by Taylor et al. obtained using the circularized Sersic Re. Right: cuts in Re and M⋆ of our sample and other samples in the size to mass plane (colours are the same in the left panel).
Current usage metrics show cumulative count of Article Views (full-text article views including HTML views, PDF and ePub downloads, according to the available data) and Abstracts Views on Vision4Press platform.
Data correspond to usage on the plateform after 2015. The current usage metrics is available 48-96 hours after online publication and is updated daily on week days.
Initial download of the metrics may take a while.