Free Access
Fig. D.1
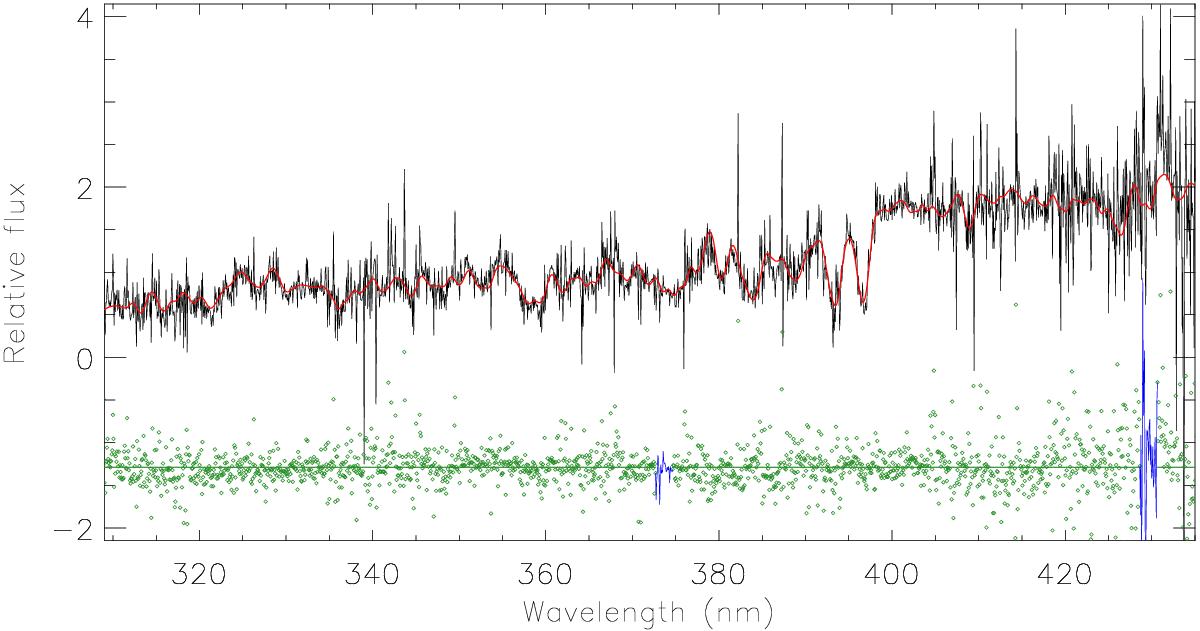
Example of the galaxy spectrum template (black line) we constructed for the real galaxy S2F1-633. The red line denotes the best-fit model, while the green points show the residuals.
Current usage metrics show cumulative count of Article Views (full-text article views including HTML views, PDF and ePub downloads, according to the available data) and Abstracts Views on Vision4Press platform.
Data correspond to usage on the plateform after 2015. The current usage metrics is available 48-96 hours after online publication and is updated daily on week days.
Initial download of the metrics may take a while.