Fig. C.1
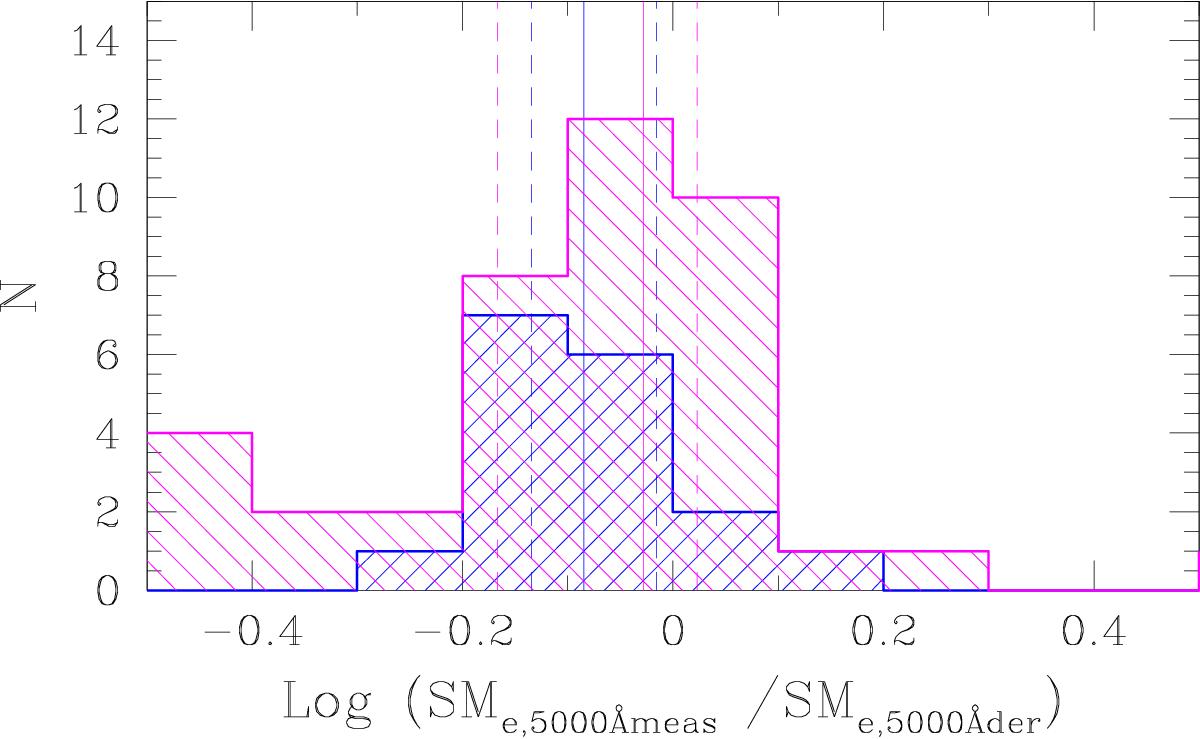
Distribution of the SMe,5000Å meas/SMe,5000Å der ratio as function of the redshift. SMRe,5000 Å meas is the semi-major axis at 5000 Å rest frame measured directly on the images, while SMe,5000Ådev is the same quantity, but inferred from F125W-band images using Eq. (2) from van der Wel et al. (2014). The blue histogram refers to ETGs at 0.5 <z< 0.7, while the magenta histogram refers to ETGs at 0.7 <z< 0.9. Solid lines are the median values of the distributions and dotted lines are the median value of the distribution at 25 and 75 percentile.
Current usage metrics show cumulative count of Article Views (full-text article views including HTML views, PDF and ePub downloads, according to the available data) and Abstracts Views on Vision4Press platform.
Data correspond to usage on the plateform after 2015. The current usage metrics is available 48-96 hours after online publication and is updated daily on week days.
Initial download of the metrics may take a while.