Fig. 4
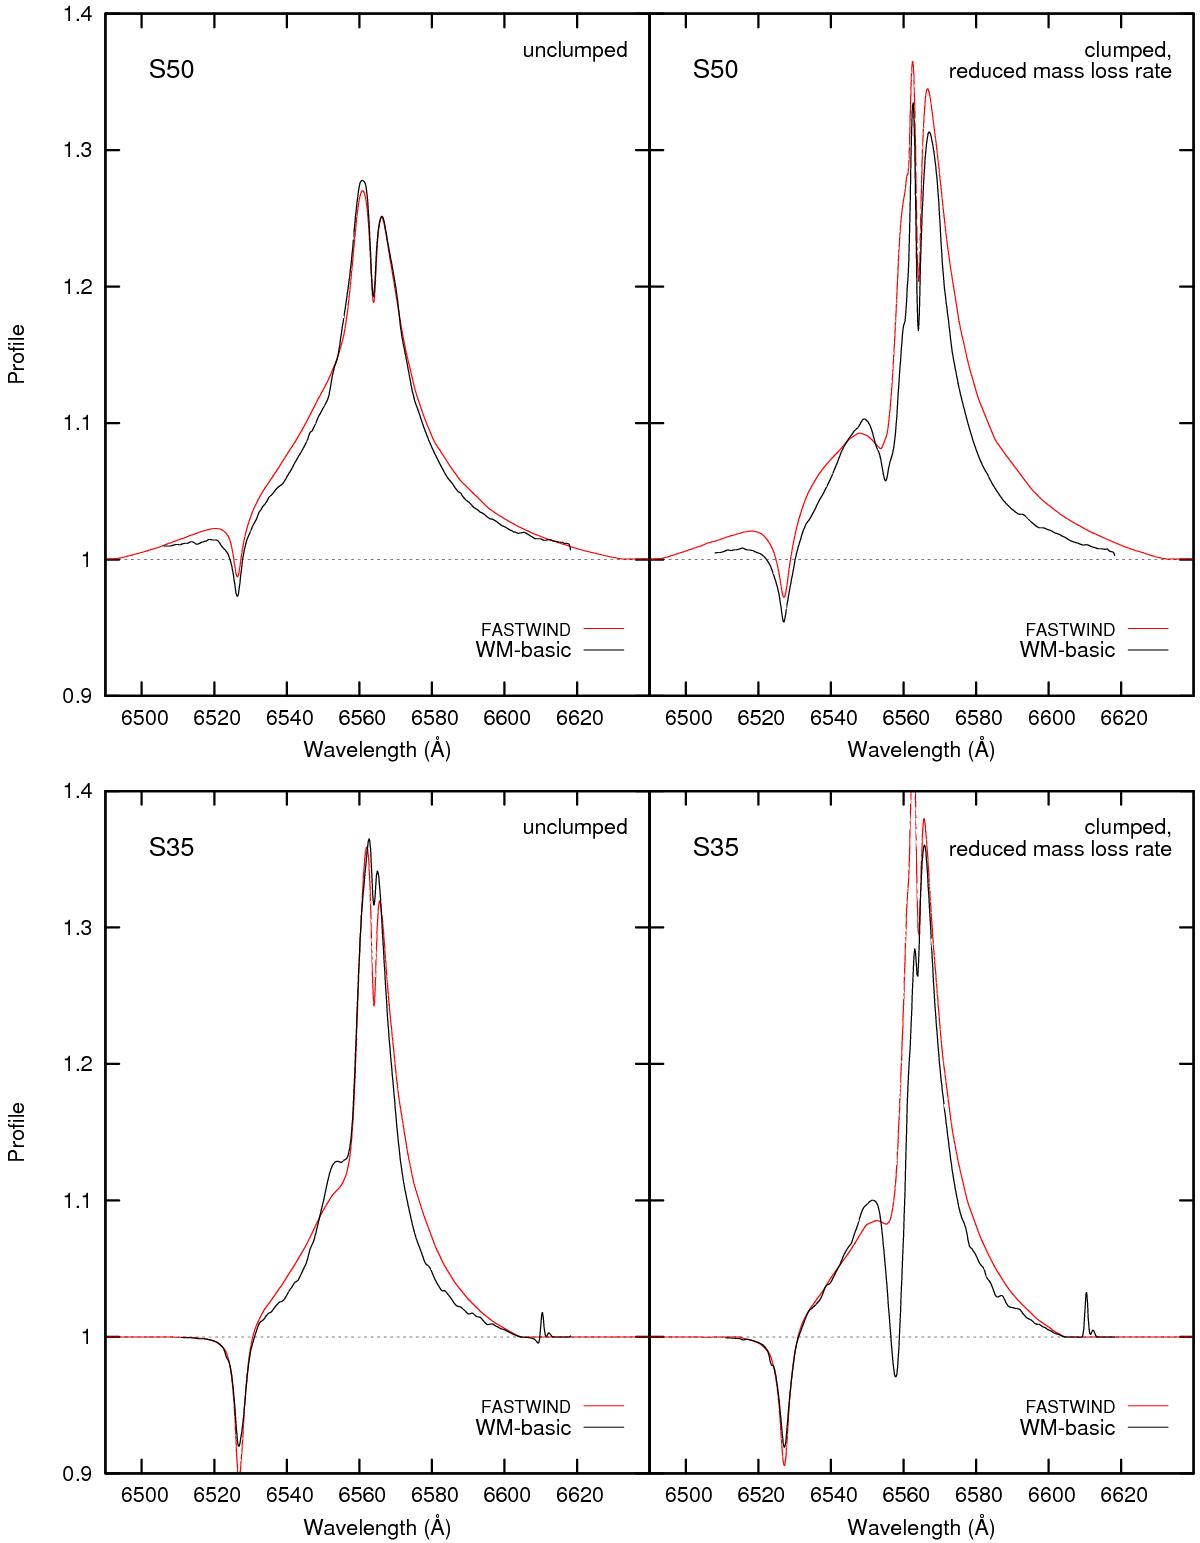
Comparison of Hα line profiles predicted by fastwind (red) and WM-basic (black). To focus the comparison on the NLTE modeling and the treatment of radiative transfer, these WM-basic calculations use the density structures from the fastwind models. Top row: Teff = 50 000 K test model (S50), bottom row: Teff = 35 000 K test model (S35). Left panels: profiles from a smooth, unclumped flow (fcl = 1), right panels: profiles from a clumped flow (fcl = 81) with a correspondingly reduced mass loss rate (by a factor of ![]() ). The differences between our WM-basic predictions and those from fastwind are negligible compared to the sensitive dependence of the Hα line on the clumping factor, as illustrated by Fig. 5.
). The differences between our WM-basic predictions and those from fastwind are negligible compared to the sensitive dependence of the Hα line on the clumping factor, as illustrated by Fig. 5.
Current usage metrics show cumulative count of Article Views (full-text article views including HTML views, PDF and ePub downloads, according to the available data) and Abstracts Views on Vision4Press platform.
Data correspond to usage on the plateform after 2015. The current usage metrics is available 48-96 hours after online publication and is updated daily on week days.
Initial download of the metrics may take a while.