Free Access
Fig. A.5
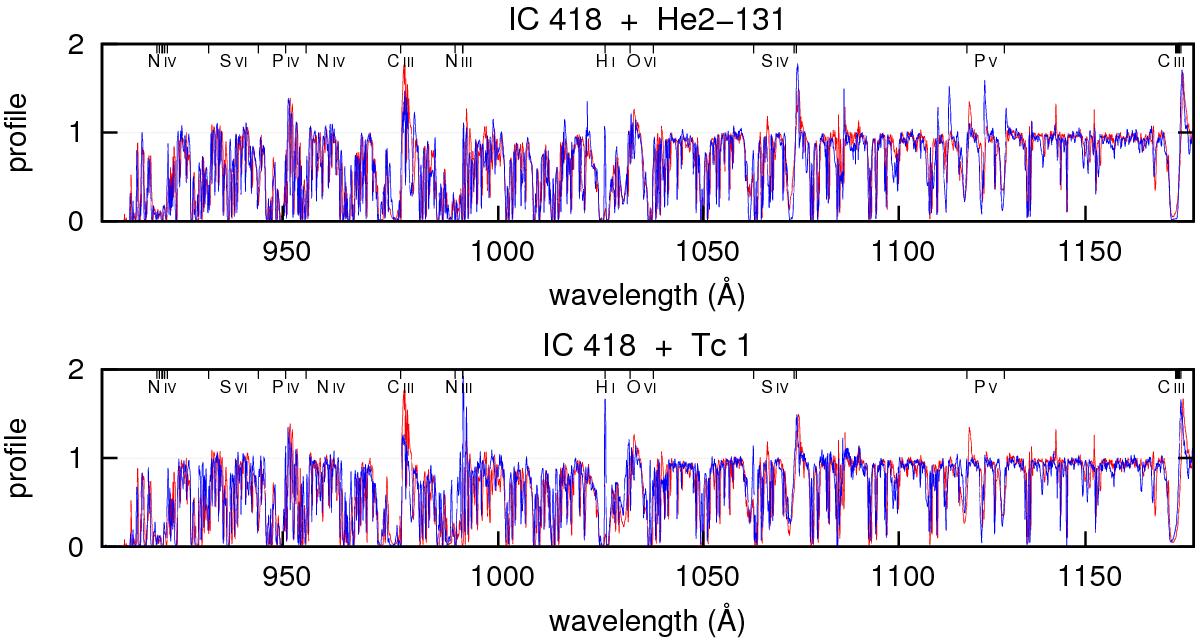
Observed FUSE spectrum of IC 418 (red), compared to the observed spectra of He 2-131 (blue, upper panel) and Tc 1 (blue, lower panel). The comparison shows that the O vi line in the spectra of Tc 1 and He 2-131 is very similar to that of IC 418 despite differences in the terminal velocity.
Current usage metrics show cumulative count of Article Views (full-text article views including HTML views, PDF and ePub downloads, according to the available data) and Abstracts Views on Vision4Press platform.
Data correspond to usage on the plateform after 2015. The current usage metrics is available 48-96 hours after online publication and is updated daily on week days.
Initial download of the metrics may take a while.