Fig. 4
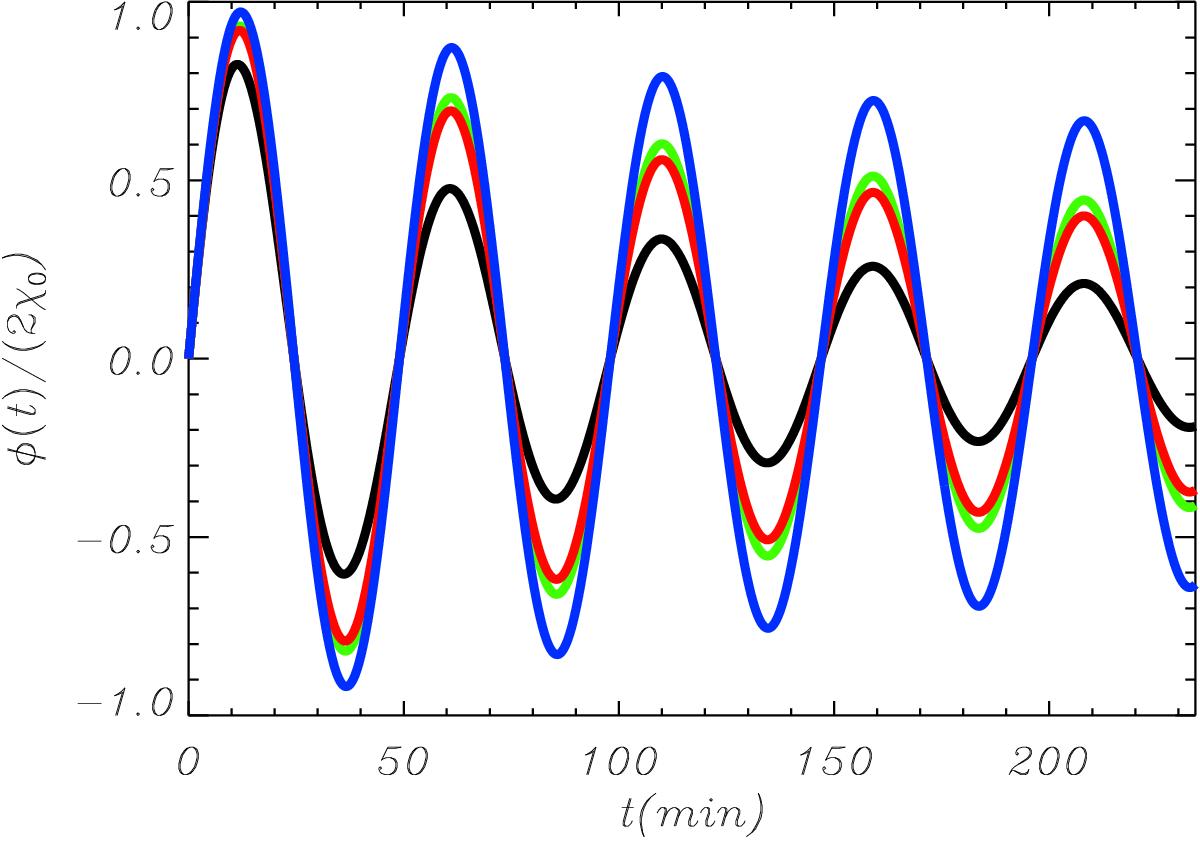
Angular position φ(τ) normalized to its amplitude 2χ0 as a function of t for various values of the parameters v and lp. We have taken g = 274 m s-2 and typical values of ζ = 100 and r = 60 Mm. In all cases the period is 49 min. The black curve corresponds to v = 30 km s-1 and lp = 2 Mm, the green curve to v = 10 km s-1 and lp = 2 Mm, the red curve to v = 40 km s-1 and lp = 5 Mm, and the blue curve to v = 10 km s-1 and lp = 5 Mm. The damping times for these combinations of parameters are td = 55.6, 166.7, 138.9, and 416.7 min, respectively.
Current usage metrics show cumulative count of Article Views (full-text article views including HTML views, PDF and ePub downloads, according to the available data) and Abstracts Views on Vision4Press platform.
Data correspond to usage on the plateform after 2015. The current usage metrics is available 48-96 hours after online publication and is updated daily on week days.
Initial download of the metrics may take a while.