Fig. 2
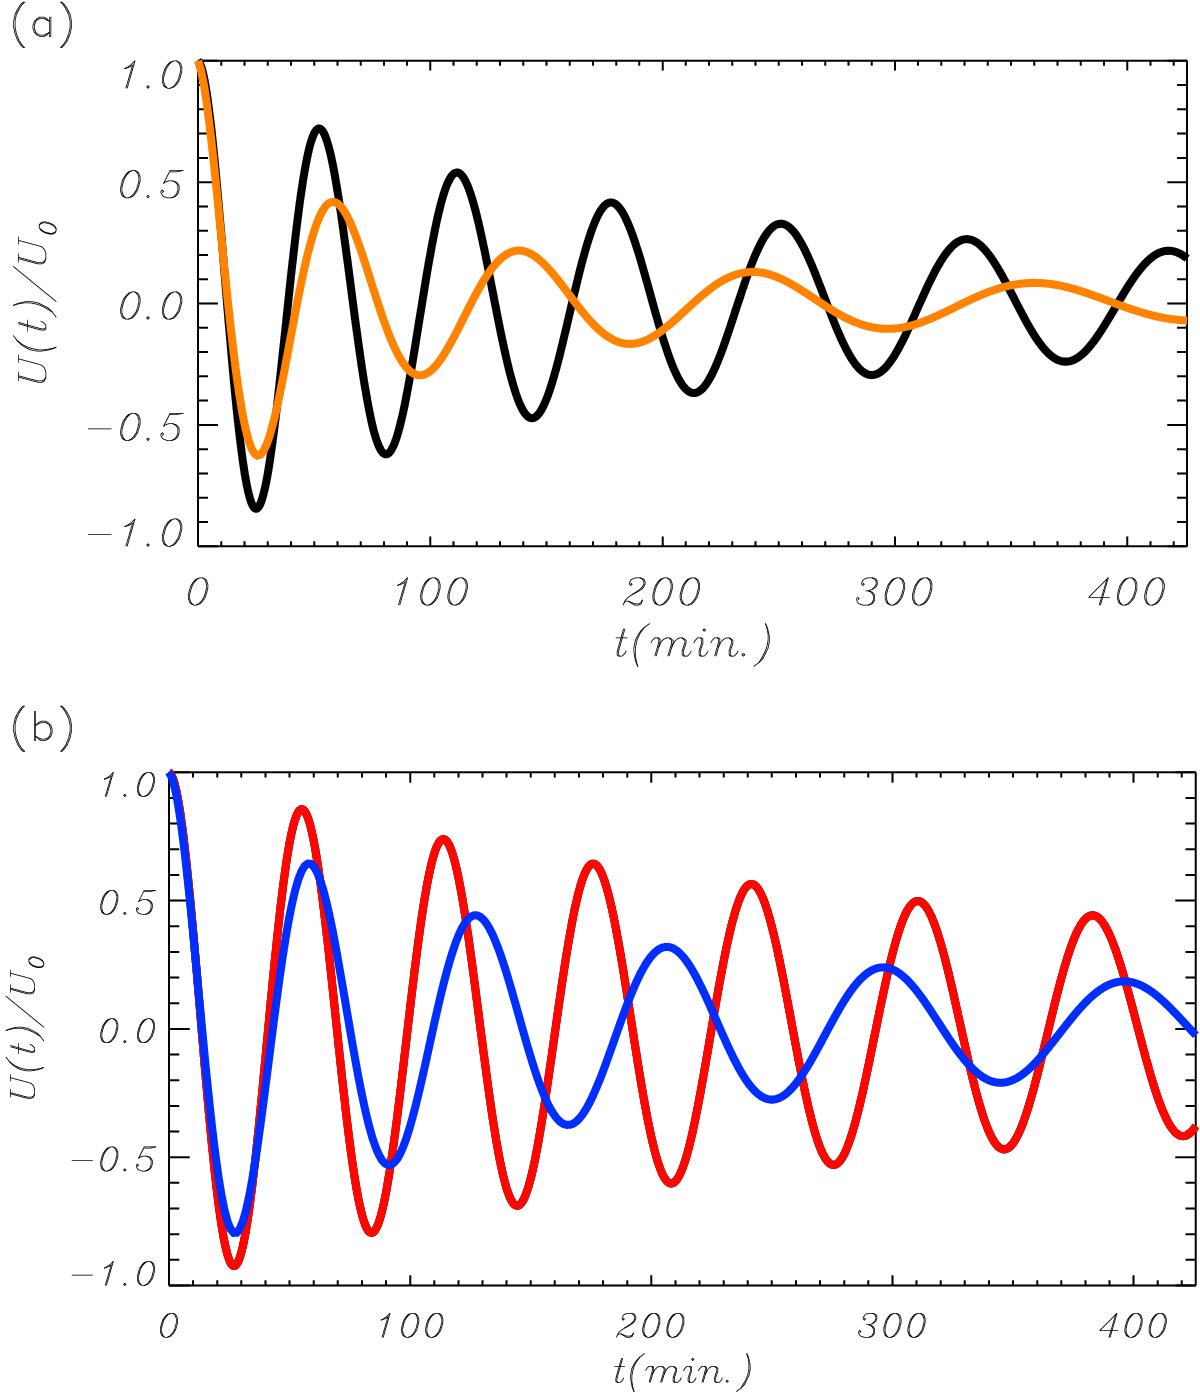
Temporal evolution of the velocity of the thread given by Eq. (35) normalized to the initial velocity U0 as function of time, t. We have assumed a typical situation of ζ = 100, r = 60 Mm, with g = 274 m s-2. For clarity, we have split the different cases studied into two panels. In a) a thread with lp = 2.1 Mm and θ = 1° is considered with v = 10 km s-1 (black curve) and v = 30 km s-1 (orange curve). In b) a thread with lp = 5 Mm and θ = 3° is considered with v = 10 km s-1 (red curve) and v = 30 km s-1 (blue curve).
Current usage metrics show cumulative count of Article Views (full-text article views including HTML views, PDF and ePub downloads, according to the available data) and Abstracts Views on Vision4Press platform.
Data correspond to usage on the plateform after 2015. The current usage metrics is available 48-96 hours after online publication and is updated daily on week days.
Initial download of the metrics may take a while.