Free Access
Fig. 2
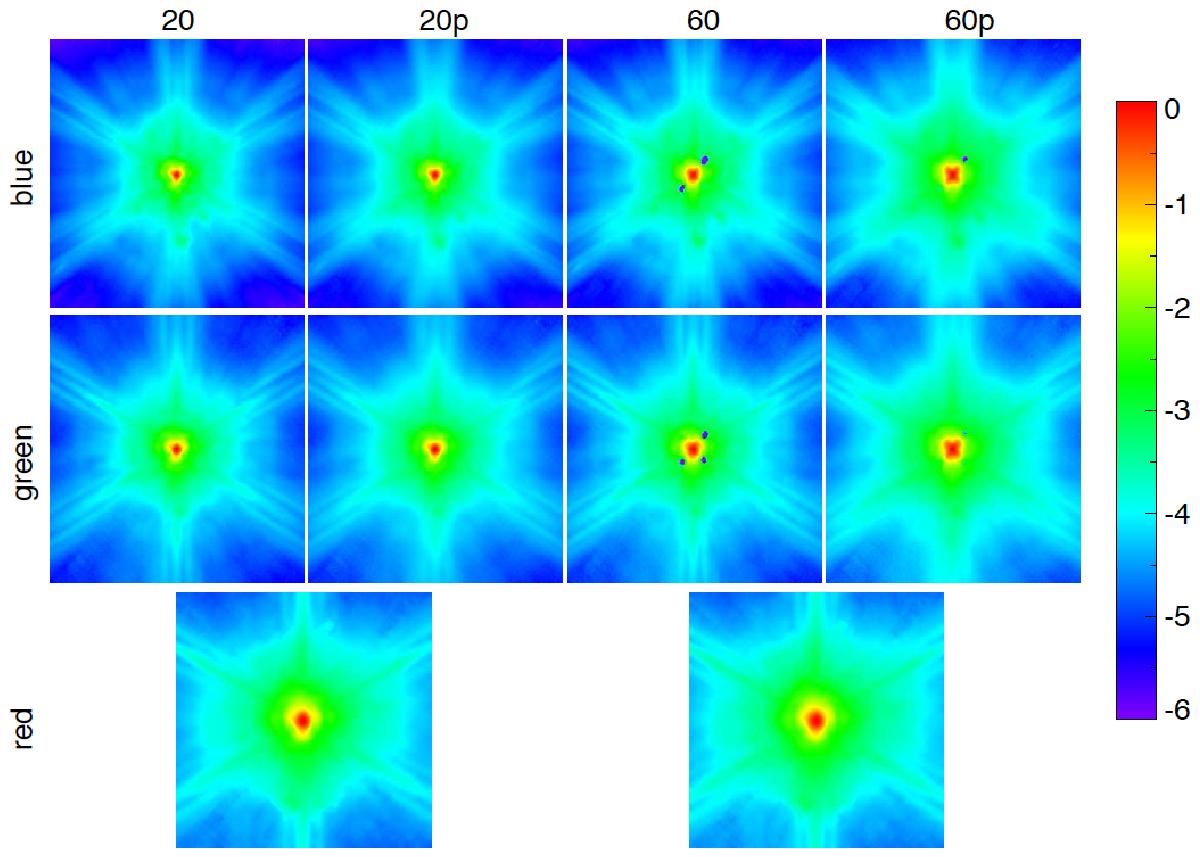
Our estimates of PACS PSFs (in log scale) as a function of the filter and scan speed. All images are 300′′ × 300′′. Red band PSFs in standard and parallel modes are exactly the same. The spacecraft Y- and Z-axis are to the left and to the top, respectively.
Current usage metrics show cumulative count of Article Views (full-text article views including HTML views, PDF and ePub downloads, according to the available data) and Abstracts Views on Vision4Press platform.
Data correspond to usage on the plateform after 2015. The current usage metrics is available 48-96 hours after online publication and is updated daily on week days.
Initial download of the metrics may take a while.