Fig. 1
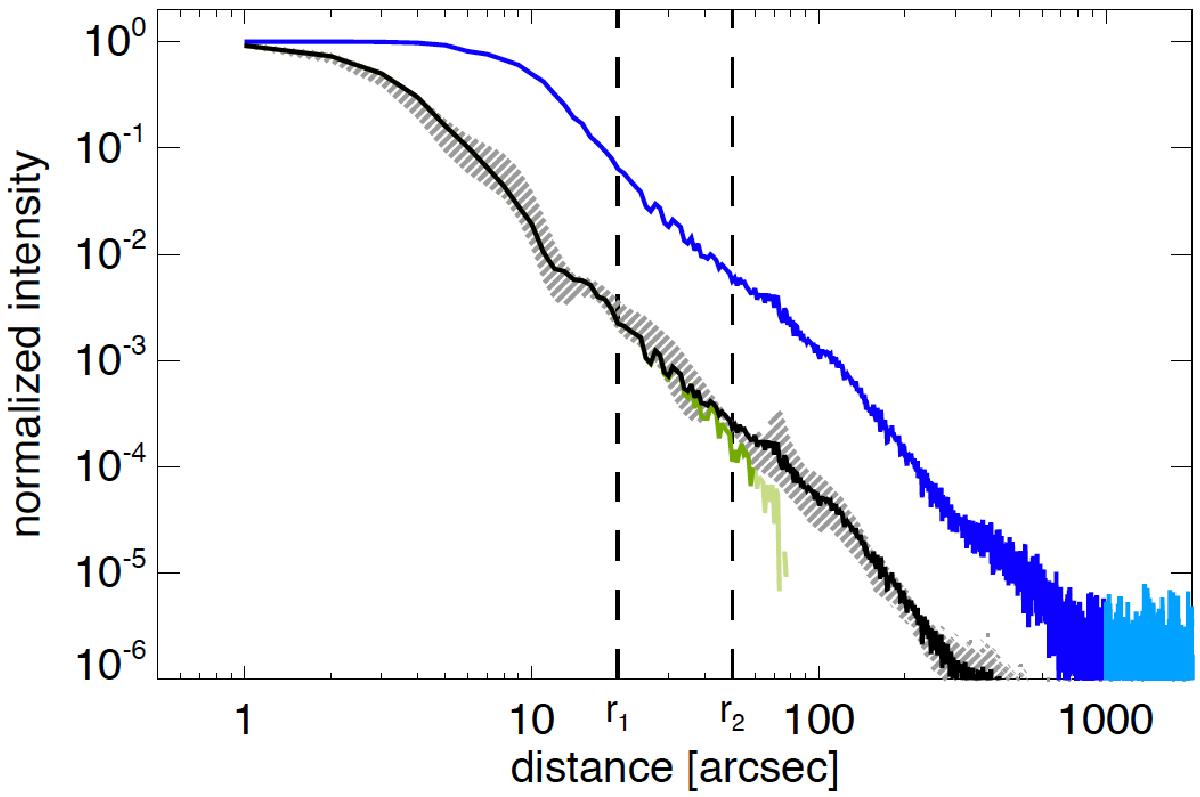
Average radial profile of Vesta (green) and Mars (blue) observations and of the estimated PSF (black) for 70 μm images at a scan speed of 20′′/s. The light green and light blue lines are Vesta and Mars profiles for r>c2. The shaded region indicates the range of profiles along different directions of the estimated PSF. Vertical dashed black lines indicate r1 and r2.
Current usage metrics show cumulative count of Article Views (full-text article views including HTML views, PDF and ePub downloads, according to the available data) and Abstracts Views on Vision4Press platform.
Data correspond to usage on the plateform after 2015. The current usage metrics is available 48-96 hours after online publication and is updated daily on week days.
Initial download of the metrics may take a while.