Fig. 6
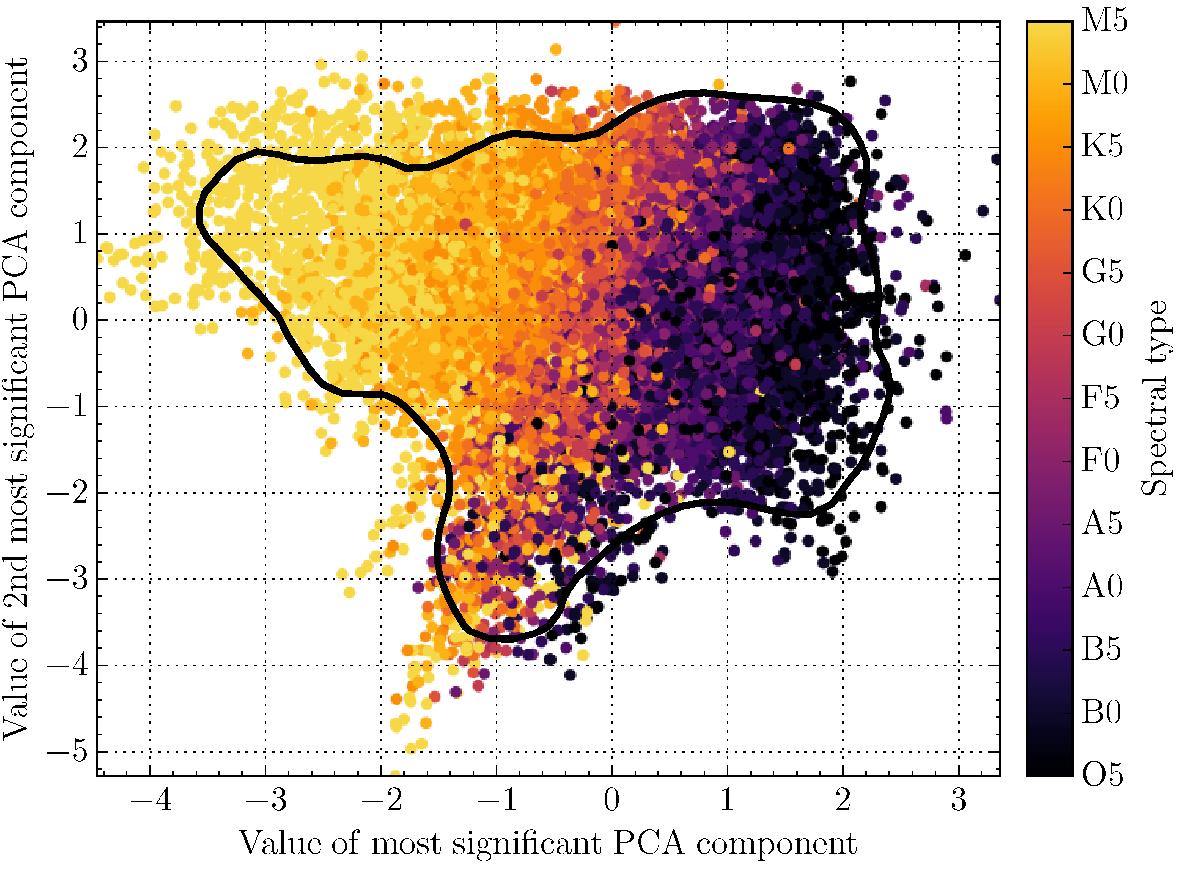
PCA decomposition of the test set data. The black line depicts the envelope of the PCA decomposition of the training data set. The x-axis corresponds to the component with the largest standard deviation (see text) in coefficients across the spectral types. The component with the second largest standard deviation is shown on the y-axis.
Current usage metrics show cumulative count of Article Views (full-text article views including HTML views, PDF and ePub downloads, according to the available data) and Abstracts Views on Vision4Press platform.
Data correspond to usage on the plateform after 2015. The current usage metrics is available 48-96 hours after online publication and is updated daily on week days.
Initial download of the metrics may take a while.