Fig. 2
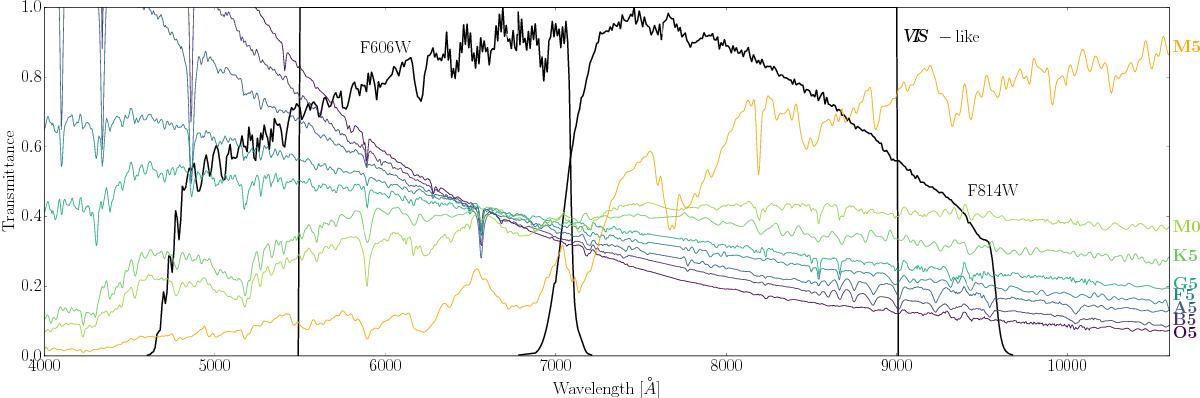
Filter profiles of the three bands used in this work (VIS from 550 to 900 nm, F606W and F814W) along with some stellar spectra of different types from Pickles (1998). For display purposes, the spectra have been normalised by their total flux in the VIS band and plotted in arbitrary units of flux. Note that to simulate stellar images, we must integrate over the wavelength-dependent PSF models, using spectra in units of photon number counts.
Current usage metrics show cumulative count of Article Views (full-text article views including HTML views, PDF and ePub downloads, according to the available data) and Abstracts Views on Vision4Press platform.
Data correspond to usage on the plateform after 2015. The current usage metrics is available 48-96 hours after online publication and is updated daily on week days.
Initial download of the metrics may take a while.