Fig. 6
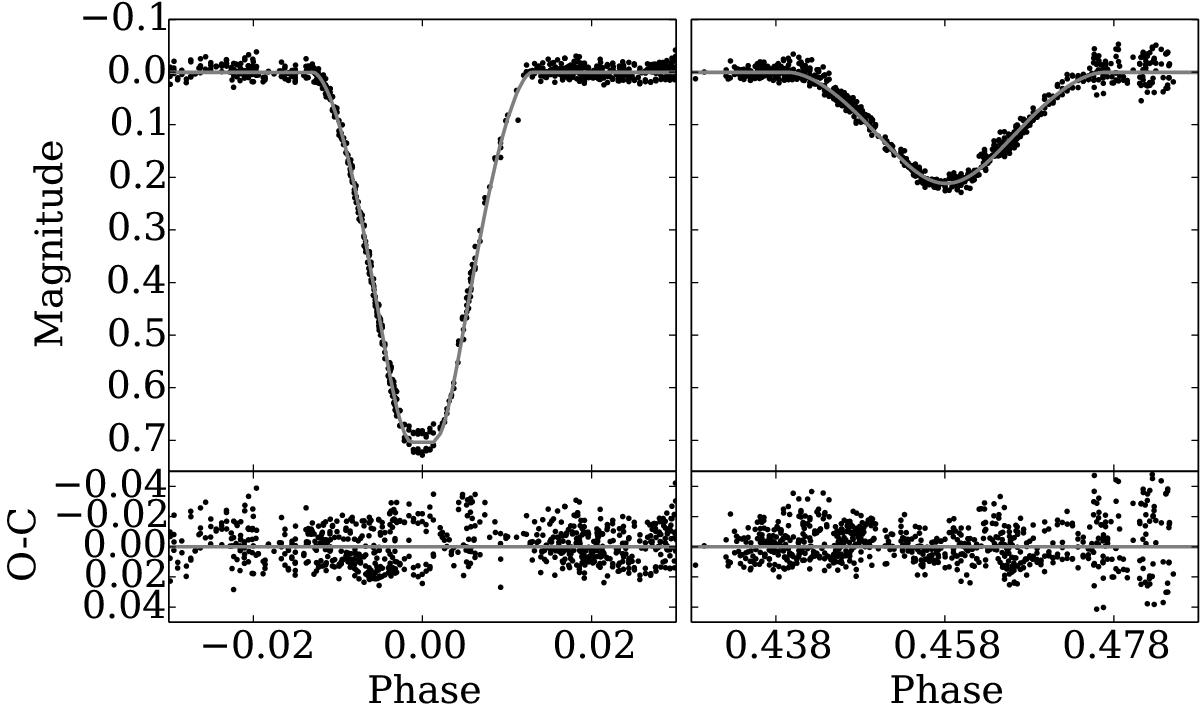
Upper panels: detrended best-fit model for AI Phe (grey line) plotted over the 200-mm WASP-South photometry for the primary (left) and secondary (right) eclipses. Lower panels: residuals between the plotted model and the data, with the grey line marking zero.
Current usage metrics show cumulative count of Article Views (full-text article views including HTML views, PDF and ePub downloads, according to the available data) and Abstracts Views on Vision4Press platform.
Data correspond to usage on the plateform after 2015. The current usage metrics is available 48-96 hours after online publication and is updated daily on week days.
Initial download of the metrics may take a while.