Fig. 4
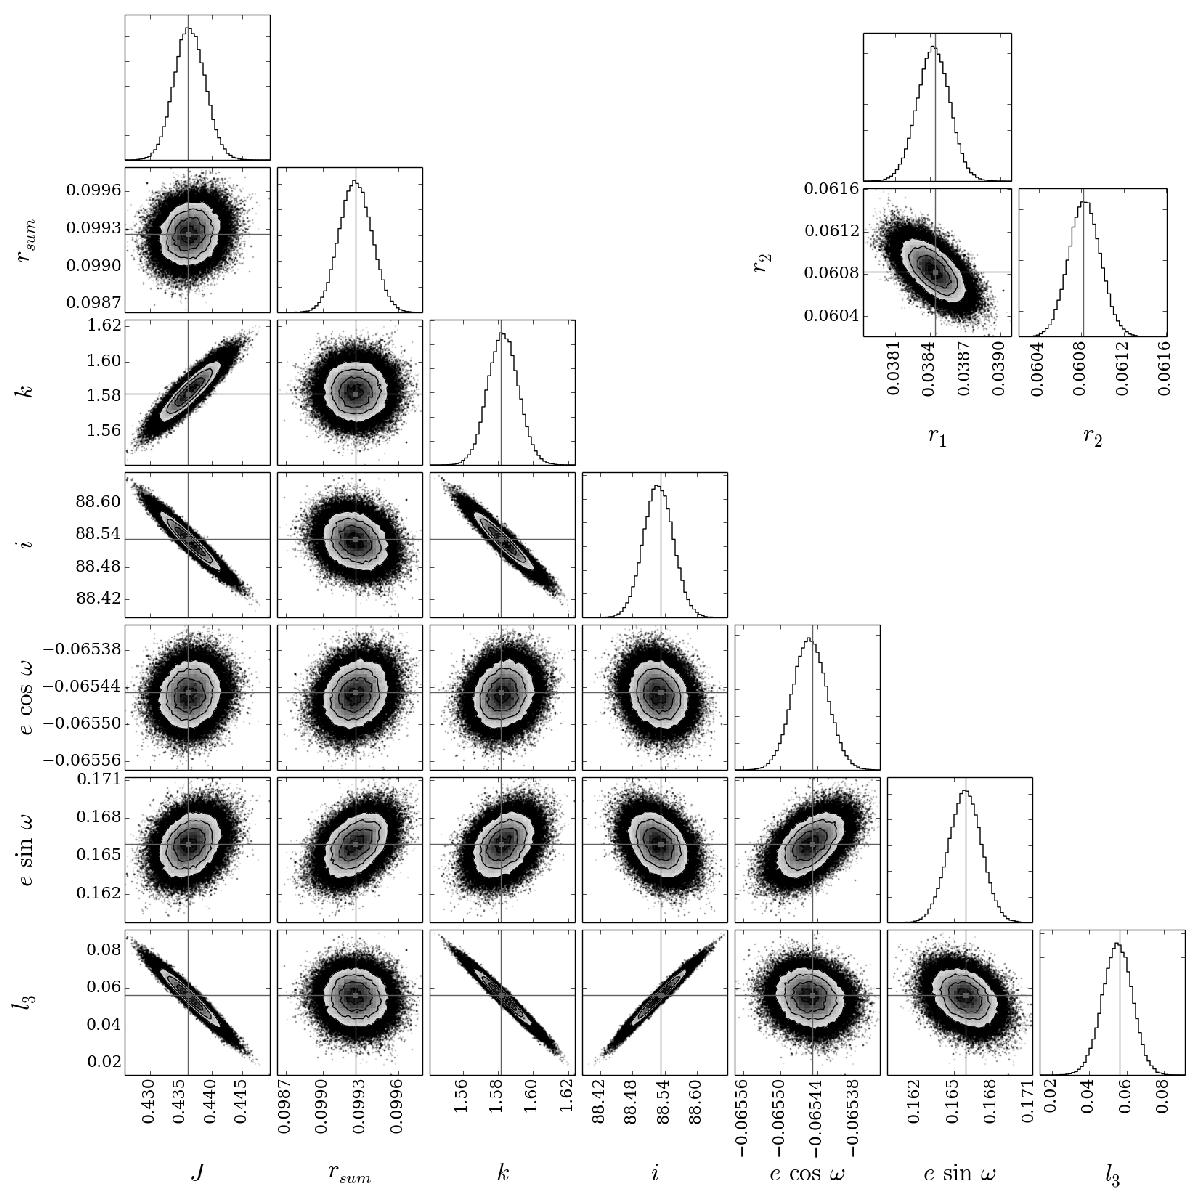
Density distribution of parameter space explored using MCMC. The best-fit parameters as determined by the model are marked by the grey crosses on the density distributions, and the grey line on the histograms. The contours on each of the distributions indicate the density of the points, with the darker, denser regions towards the centre of each plot. The distribution for r1 and r2 has been calculated from k and rsum. Data shown is for the 85-mm original data, without priors.
Current usage metrics show cumulative count of Article Views (full-text article views including HTML views, PDF and ePub downloads, according to the available data) and Abstracts Views on Vision4Press platform.
Data correspond to usage on the plateform after 2015. The current usage metrics is available 48-96 hours after online publication and is updated daily on week days.
Initial download of the metrics may take a while.