Fig. 5
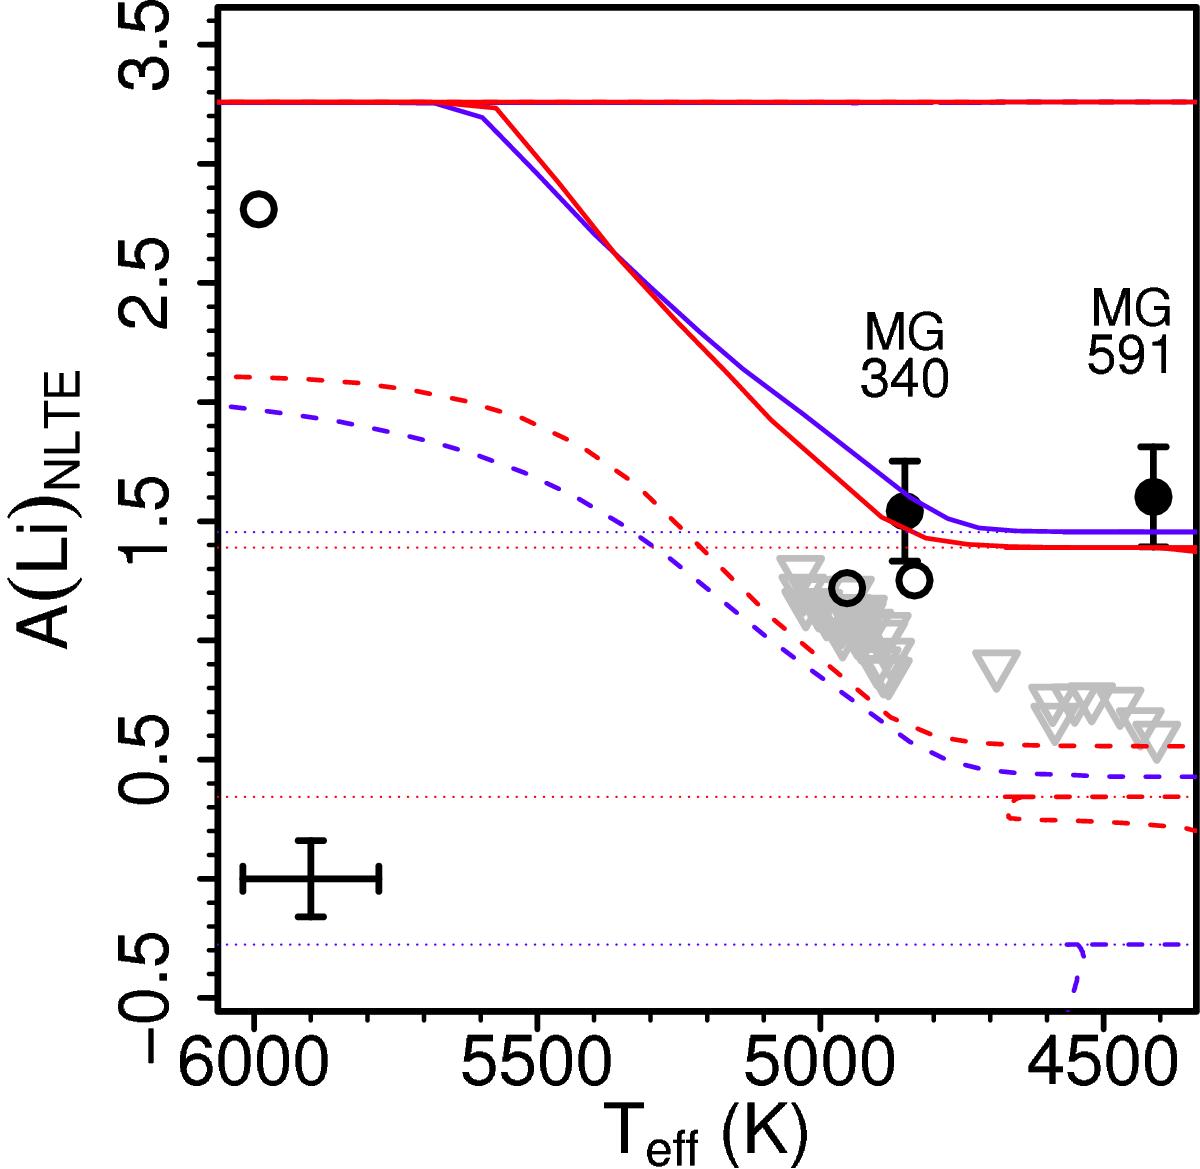
Lithium abundance as a function of Teff. The two Li-rich giants are shown as filled circles, other giants with Li detections as open circles, and giants with Li upper limits as gray triangles. Solid lines are the predictions of standard models and dashed lines of models with rotation-induced mixing and thermohaline mixing (Lagarde et al. 2012). Lines in blue and red are for solar metallicity stars of 1.5 M⊙ and 2.0 M⊙, respectively. The dotted lines are included as an eye guide to the Li abundance level of clump giants in the models (but we note here that the clump phase does not span the Teff range of the dotted lines in the plot).
Current usage metrics show cumulative count of Article Views (full-text article views including HTML views, PDF and ePub downloads, according to the available data) and Abstracts Views on Vision4Press platform.
Data correspond to usage on the plateform after 2015. The current usage metrics is available 48-96 hours after online publication and is updated daily on week days.
Initial download of the metrics may take a while.