Fig. 5
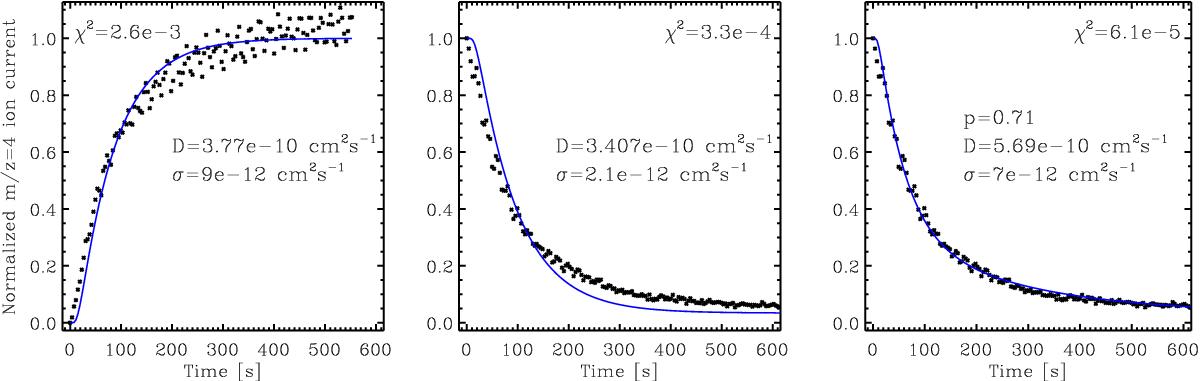
Evolution of the normalized m/z = 4 ion current (black dots), equivalent to the normalized D2 flux at the x = l surface, during (left panel) and after (middle and right panels) VUV irradiation of a 2.6 μm a-C:D analog at 130 K. Theoretical models fitting the experimental data are presented (blue solid lines), along with the derived diffusion coefficient D and the 1σ associated error. The model shown in the left panel is described by Eq. (6). The middle and right panels show the models described by Eqs. (11) and (12), respectively. The free parameter p of the latter is an indicator of how close the model is to the one described by Eq. (11). The χ2 values associated with the fits of the experimental data during and after irradiation cannot be directly compared since they are not normalized.
Current usage metrics show cumulative count of Article Views (full-text article views including HTML views, PDF and ePub downloads, according to the available data) and Abstracts Views on Vision4Press platform.
Data correspond to usage on the plateform after 2015. The current usage metrics is available 48-96 hours after online publication and is updated daily on week days.
Initial download of the metrics may take a while.