Fig. 4
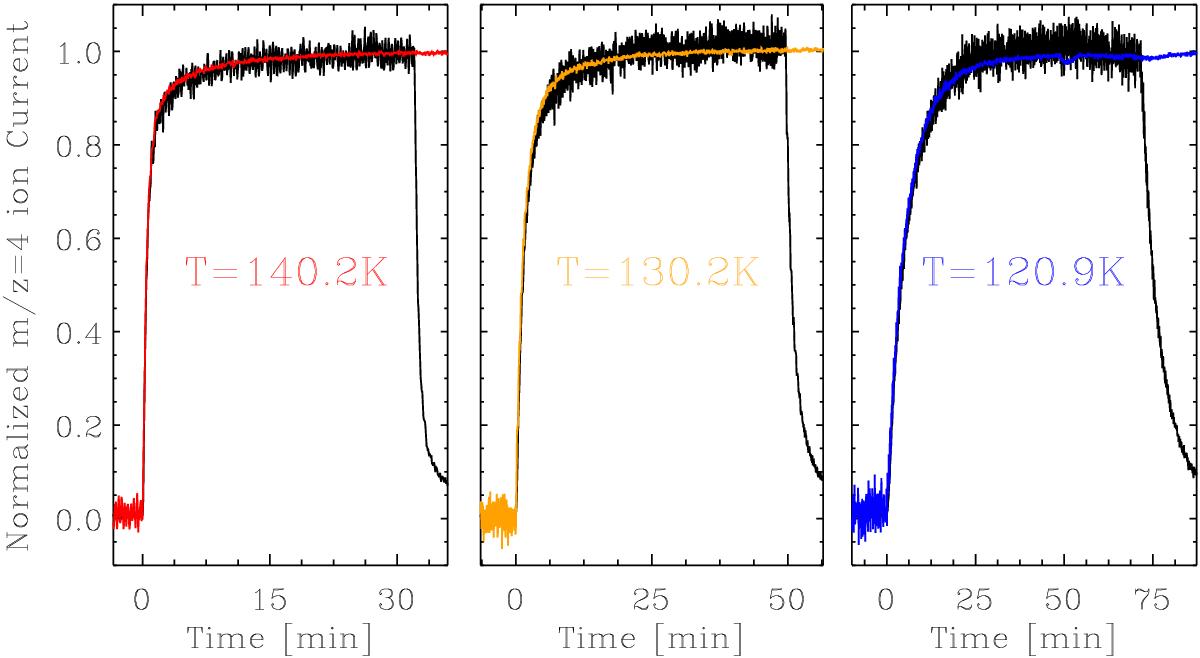
Normalized m/z = 4 ion current after background substraction (equivalent to the normalized D2 flux) during three experiments performed at ~140 K (left panel), ~130 K (middle panel), and ~120 K (right panel) on a 3.4 μm thick a-C:D analog. Black solid lines correspond to the normalized D2 flux during irradiation (irradiation starts at t = 0), while colored solid lines correspond to 1 – normalized D2 flux after irradiation (irradiation stops at t = 0).
Current usage metrics show cumulative count of Article Views (full-text article views including HTML views, PDF and ePub downloads, according to the available data) and Abstracts Views on Vision4Press platform.
Data correspond to usage on the plateform after 2015. The current usage metrics is available 48-96 hours after online publication and is updated daily on week days.
Initial download of the metrics may take a while.