Fig. A.3
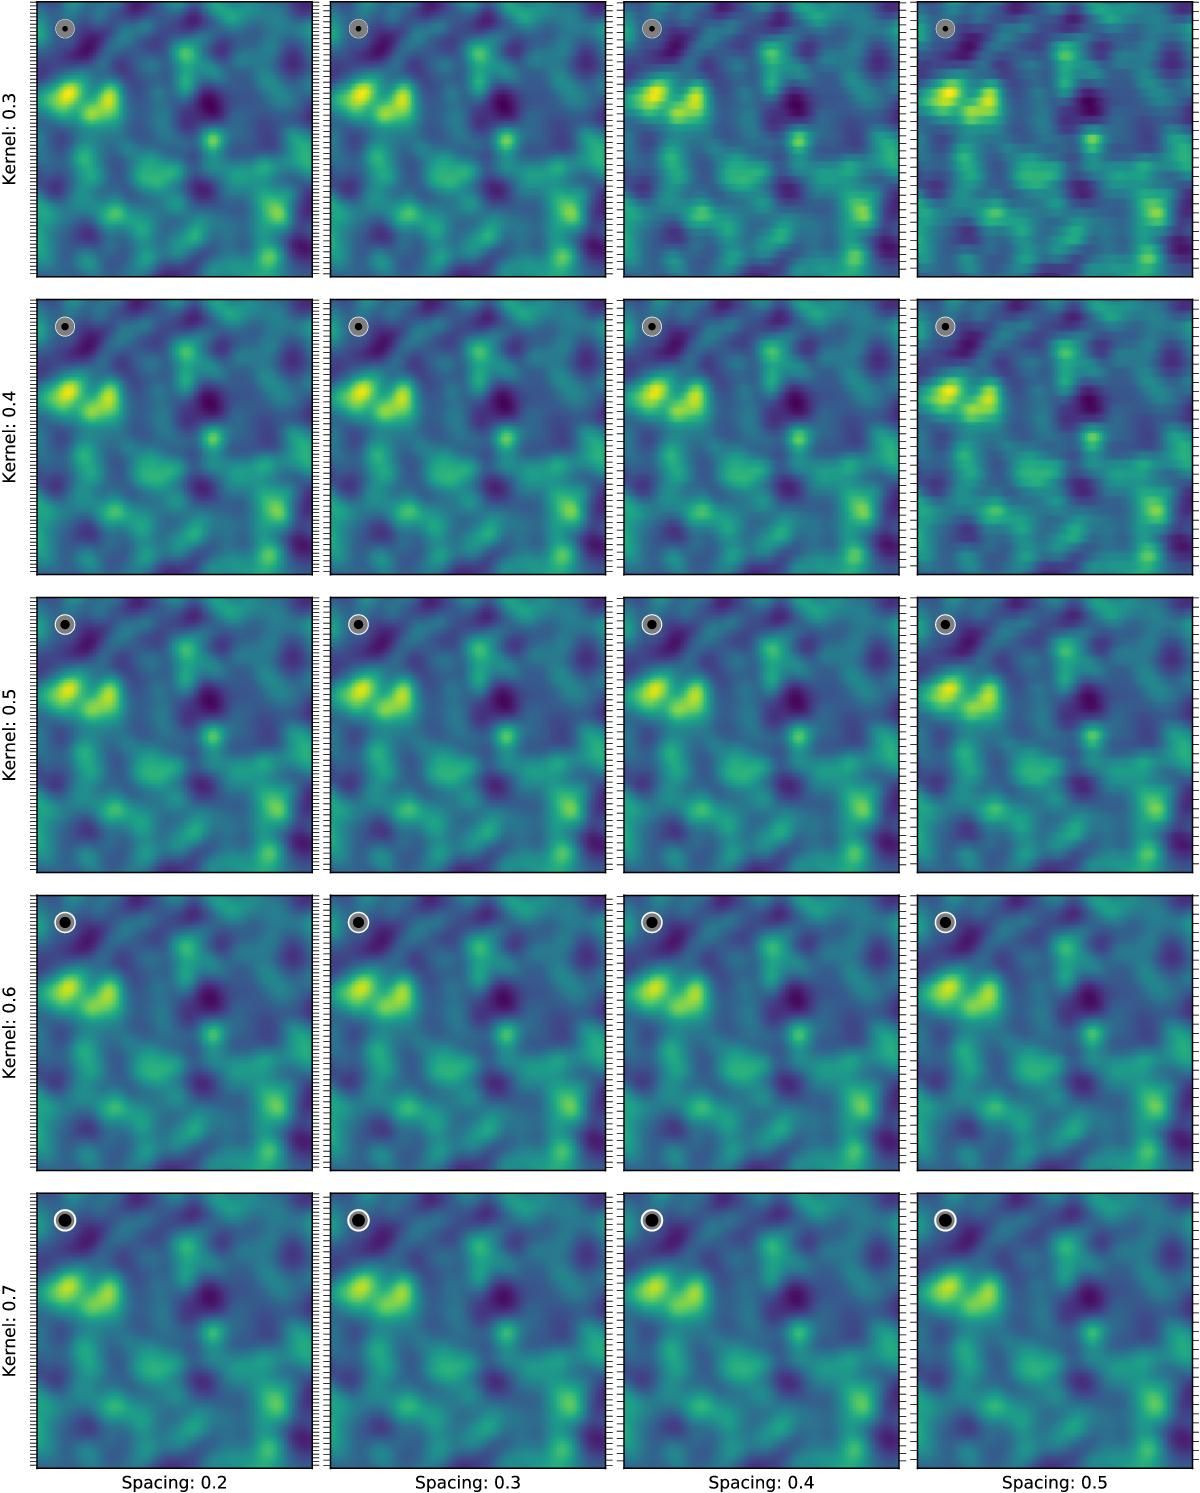
Impact of different sampling densities and kernel sizes on the accuracy of the gridding algorithm. Input samples are distributed on horizontal stripes (scan lines), separated with the given spacing (in units of the beam size). The locations of the stripes are indicated by the tick marks on the vertical axes. Various kernel sizes (also in units of beam size) were applied to image the artificial signal. In the top left of each panel the kernel size (black circle), beam size (gray circle), and resulting (theoretical) image resolution (white circle) are visualized. See text for further details.
Current usage metrics show cumulative count of Article Views (full-text article views including HTML views, PDF and ePub downloads, according to the available data) and Abstracts Views on Vision4Press platform.
Data correspond to usage on the plateform after 2015. The current usage metrics is available 48-96 hours after online publication and is updated daily on week days.
Initial download of the metrics may take a while.